Answered step by step
Verified Expert Solution
Question
1 Approved Answer
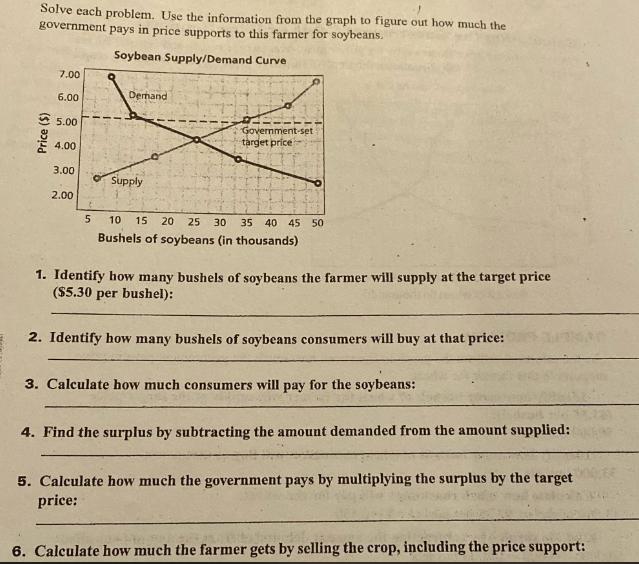
Solve each problem. Use the information from the graph to figure out how much the government pays in price supports to this farmer for

Solve each problem. Use the information from the graph to figure out how much the government pays in price supports to this farmer for soybeans. Soybean Supply/Demand Curve Price ($) 7.00 Dernand 6.00 5.00 4.00 Government-set target price 3.00 Supply 2.00 5 10 15 20 25 30 35 40 45 50 Bushels of soybeans (in thousands) 1. Identify how many bushels of soybeans the farmer will supply at the target price ($5.30 per bushel): 2. Identify how many bushels of soybeans consumers will buy at that price: 3. Calculate how much consumers will pay for the soybeans: 4. Find the surplus by subtracting the amount demanded from the amount supplied: 5. Calculate how much the government pays by multiplying the surplus by the target price: 6. Calculate how much the farmer gets by selling the crop, including the price support:
Step by Step Solution
There are 3 Steps involved in it
Step: 1
To solve each problem lets follow the steps 1 Identify how many bushels of soybeans the farmer will supply at the target price 530 per bushel The farm...
Get Instant Access to Expert-Tailored Solutions
See step-by-step solutions with expert insights and AI powered tools for academic success
Step: 2

Step: 3

Ace Your Homework with AI
Get the answers you need in no time with our AI-driven, step-by-step assistance
Get Started


