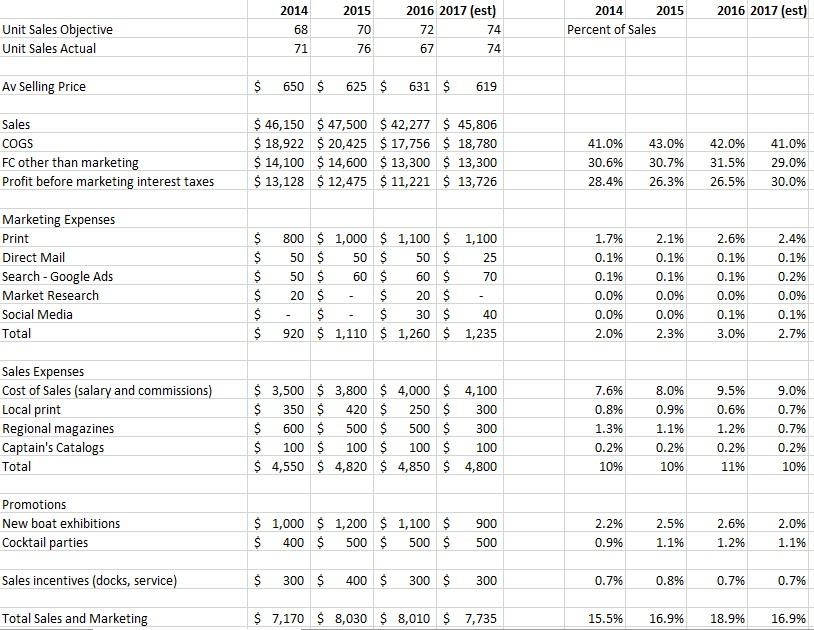
 Solve for cost per prospect and cost per sales.
2014 2016 2017 (est) 68 2015 70 76 2014 2015 Percent of Sales Unit Sales Objective Unit Sales Actual 2016 2017 (est) 72 74 67 71 74 Av Selling Price $ 650 $ 625 $ 631 $ 619 41.0% Sales COGS FC other than marketing Profit before marketing interest taxes $ 46,150 $ 47,500 $ 42,277 $ 45,806 $ 18,922 $ 20,425 $ 17,756 $ 18,780 $ 14,100 $ 14,600 $ 13,300 $ 13,300 $ 13,128 $ 12,475 $ 11,221 $ 13,726 41.0% 30.6% 28.4% 43.0% 30.7% 42.0% 31.5% 26.5% 29.0% 30.0% 26.3% 2.4% Marketing Expenses Print Direct Mail Search - Google Ads Market Research Social Media Total 2.1% 0.1% 0.1% 0.1% $ $ $ $ $ $ 800 $1,000 $ 1,100 $ 1,100 50 $ 50 $ 50 $ 25 50 $ 60 $ 60 $ 70 20 $ $ 20 $ $ $ 30 $ 40 920 $ 1,110 $ 1,260 $ 1,235 1.7% 0.1% 0.1% 0.0% 0.0% 2.0% 2.6% 0.1% 0.1% 0.0% 0.1% 3.0% 0.2% 0.0% 0.1% 2.7% 0.0% 0.0% 2.3% $ . 9.0% Sales Expenses Cost of Sales (salary and commissions) Local print Regional magazines Captain's Catalogs Total $ 3,500 $ 3,800 $ 4,000 $4,100 $ 350 $ 420 $ 250 $ 300 $ 600 $ 500 $ 500 $ 300 $ 100 $ 100 $ 100 $ 100 $ 4,550 $ 4,820 $ 4,850 $ 4,800 7.6% 0.8% 1.3% 0.29 10% 8.0% 0.9% 1.1% 9.5% 0.6% 1.2% 0.7% 0.7% 0.2% 10% 0.29% 0.2% 11% 10% Promotions New boat exhibitions Cocktail parties 2.2% 2.5% 2.6% $1,000 $1,200 $ 1,100 $ $ 400 $ 500 $ 500 $ 900 500 2.0% 1.1% 0.9% 1.1% 1.2% Sales incentives (docks, service) $ 300 $ 400 $ 300 $ 300 0.7% 0.8% 0.7% 0.7% Total Sales and Marketing $ 7,170 $ 8,030 $ 8,010 $ 7,735 15.5% 16.9% 18.9% 16.9% Yield 2014 Cost per Prospect 2014 2015 Cost per Sale 2014 2015 2016 2015 2016 2015 2016 Prospects 2014 Print 420 Direct Mai 170 Search 210 2016 390 135 2015 480 160 270 11 Sales 2014 10 9 11 5 2016 2.8% 3.7% 5.0% 2.4% 5.3% 5.7% 11 15 2.3% 6.9% 5.6% 320 12 16 45 56 69 3 3 4 6.7% Local Print Regional N Cap Cats 25 38 1 2 2 4.0% 34 280 5.4% 5.9% 5.7% 5.8% 5.3% 5.9% 235 270 15 16 16 6.4% 220 280 225 8 7 Exhibition Cocktail Referrals 6 4 120 100 00 + 9 110 133 8 3.6% 8.2% 3.0% 2.5% 6.7% 2.7% 2.7% 4.0% 3.3% 110 90 4 3 3 2014 2016 2017 (est) 68 2015 70 76 2014 2015 Percent of Sales Unit Sales Objective Unit Sales Actual 2016 2017 (est) 72 74 67 71 74 Av Selling Price $ 650 $ 625 $ 631 $ 619 41.0% Sales COGS FC other than marketing Profit before marketing interest taxes $ 46,150 $ 47,500 $ 42,277 $ 45,806 $ 18,922 $ 20,425 $ 17,756 $ 18,780 $ 14,100 $ 14,600 $ 13,300 $ 13,300 $ 13,128 $ 12,475 $ 11,221 $ 13,726 41.0% 30.6% 28.4% 43.0% 30.7% 42.0% 31.5% 26.5% 29.0% 30.0% 26.3% 2.4% Marketing Expenses Print Direct Mail Search - Google Ads Market Research Social Media Total 2.1% 0.1% 0.1% 0.1% $ $ $ $ $ $ 800 $1,000 $ 1,100 $ 1,100 50 $ 50 $ 50 $ 25 50 $ 60 $ 60 $ 70 20 $ $ 20 $ $ $ 30 $ 40 920 $ 1,110 $ 1,260 $ 1,235 1.7% 0.1% 0.1% 0.0% 0.0% 2.0% 2.6% 0.1% 0.1% 0.0% 0.1% 3.0% 0.2% 0.0% 0.1% 2.7% 0.0% 0.0% 2.3% $ . 9.0% Sales Expenses Cost of Sales (salary and commissions) Local print Regional magazines Captain's Catalogs Total $ 3,500 $ 3,800 $ 4,000 $4,100 $ 350 $ 420 $ 250 $ 300 $ 600 $ 500 $ 500 $ 300 $ 100 $ 100 $ 100 $ 100 $ 4,550 $ 4,820 $ 4,850 $ 4,800 7.6% 0.8% 1.3% 0.29 10% 8.0% 0.9% 1.1% 9.5% 0.6% 1.2% 0.7% 0.7% 0.2% 10% 0.29% 0.2% 11% 10% Promotions New boat exhibitions Cocktail parties 2.2% 2.5% 2.6% $1,000 $1,200 $ 1,100 $ $ 400 $ 500 $ 500 $ 900 500 2.0% 1.1% 0.9% 1.1% 1.2% Sales incentives (docks, service) $ 300 $ 400 $ 300 $ 300 0.7% 0.8% 0.7% 0.7% Total Sales and Marketing $ 7,170 $ 8,030 $ 8,010 $ 7,735 15.5% 16.9% 18.9% 16.9% Yield 2014 Cost per Prospect 2014 2015 Cost per Sale 2014 2015 2016 2015 2016 2015 2016 Prospects 2014 Print 420 Direct Mai 170 Search 210 2016 390 135 2015 480 160 270 11 Sales 2014 10 9 11 5 2016 2.8% 3.7% 5.0% 2.4% 5.3% 5.7% 11 15 2.3% 6.9% 5.6% 320 12 16 45 56 69 3 3 4 6.7% Local Print Regional N Cap Cats 25 38 1 2 2 4.0% 34 280 5.4% 5.9% 5.7% 5.8% 5.3% 5.9% 235 270 15 16 16 6.4% 220 280 225 8 7 Exhibition Cocktail Referrals 6 4 120 100 00 + 9 110 133 8 3.6% 8.2% 3.0% 2.5% 6.7% 2.7% 2.7% 4.0% 3.3% 110 90 4 3 3

 Solve for cost per prospect and cost per sales.


