 Solve for the ratios of both companies. Pretend that 2018 is 2015 and 2017 is 2014

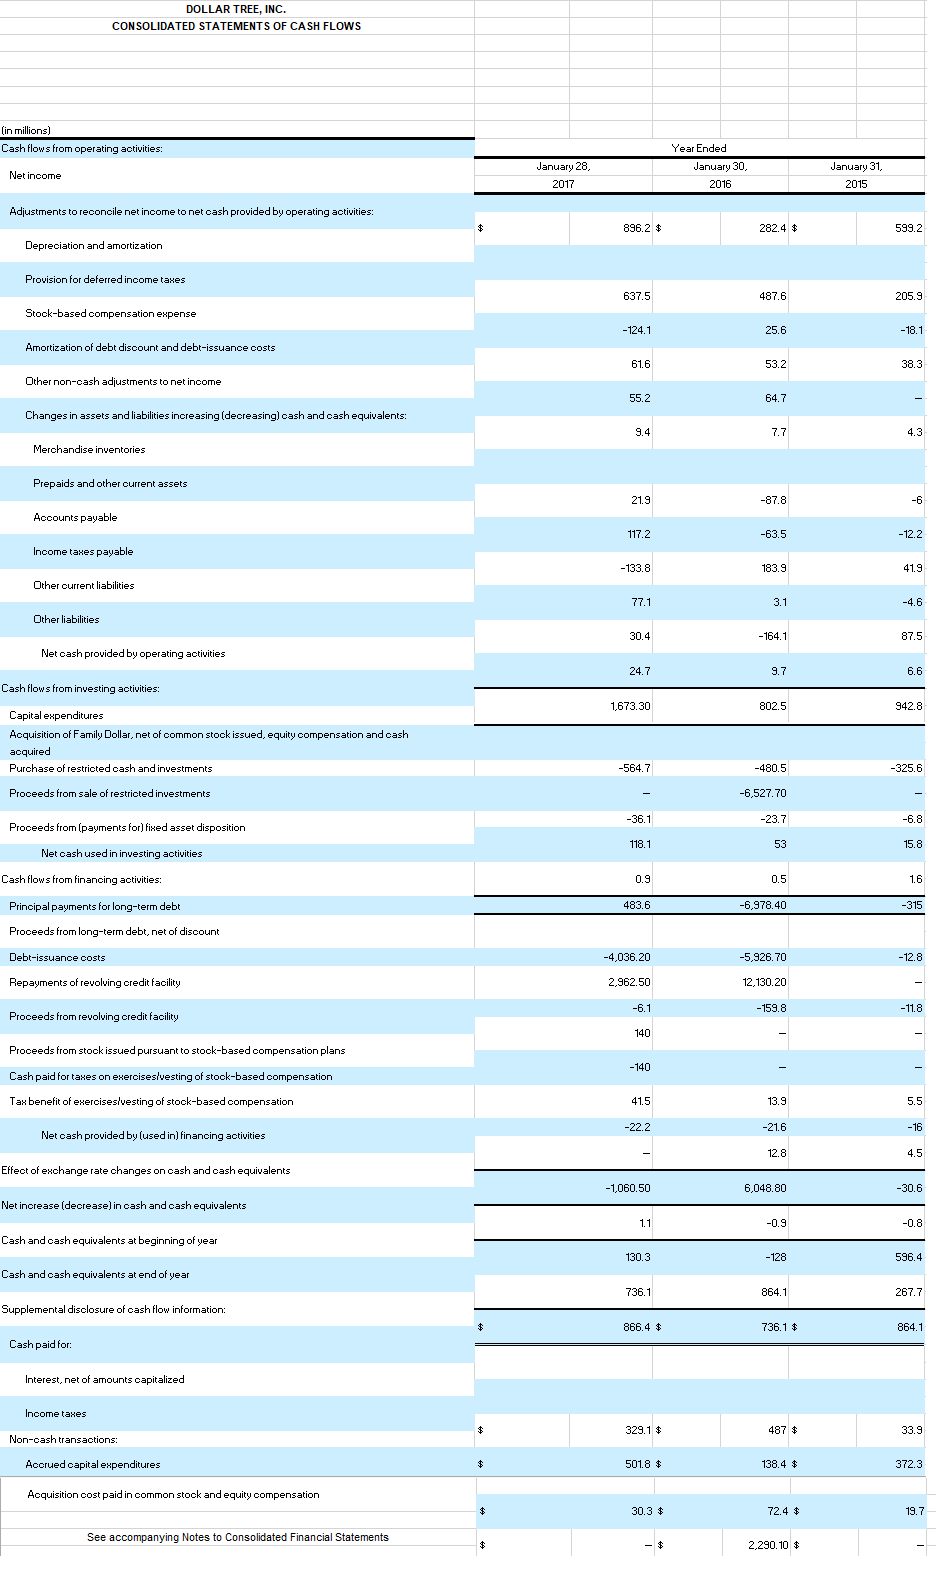
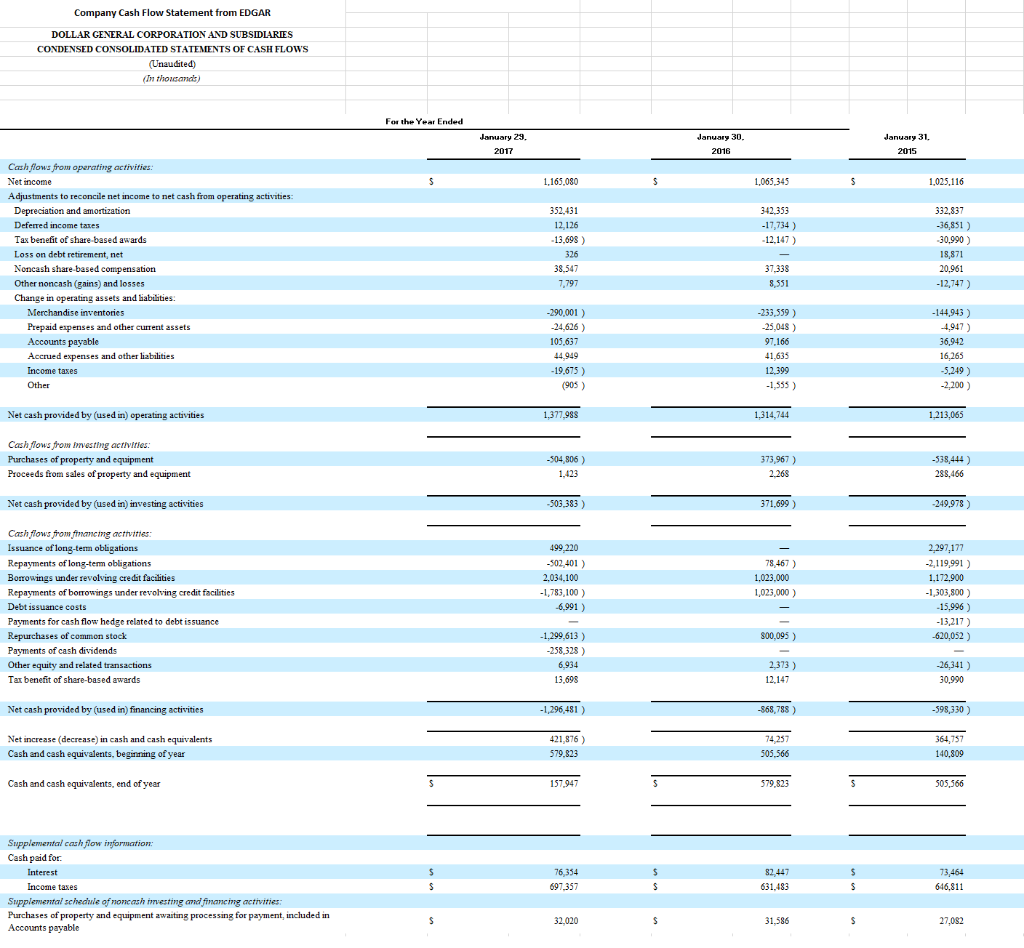
DOLLAR TREE, INC. CONSOLIDATED STATEMENTS OF CASH FLOWS (in millions) Cash flows from operating activities: Year Ended January 30, 2016 January 28, 2017 Net income January 31, 2015 Adjustments to reconcile net income to net cash provided by operating activities: 896.2 $ 282.4 $ 599.2 Depreciation and amortization Provision for deferred income taxes 637.5 487.6 205.9 Stock-based compensation expense -124.1 25.6 -18.1 Amortization of debt discount and debt-issuance costs 61.6 53.2 38.3 Other non-cash adjustments to net income 55.2 64.7 Changes in assets and liabilities increasing (decreasing) cash and cash equivalents: Merchandise inventories Prepaids and other current assets 21.9 -87.8 Accounts payable 117.2 -63.5 Income taxes payable -133.8 183.9 41.9 Other current liabilities 77.1 3.1 -4.6 Other liabilities 30.4 -164.1 87.5 Net cash provided by operating activities 24.7 Cash flows from investing activities: 1,673.30 802.5 942.8 Capital expenditures Acquisition of Family Dollar, net of common stock issued, equity compensation and oash acquired Purchase of restricted cash and investments -564.7 -480.5 -325.6 Proceeds from sale of restricted investments -6,527.70 -36.1 -6.8 Proceeds from (payments for) fixed asset disposition -23.7 53 118.1 15.8 Net cash used in investing activities Cash flows from financing activities: 0.9 0.5 1.6 483.6 -6,978,40 -315 Principal payments for long-term debt Proceeds from long-term debt, net of discount Debt-issuance costs -12.8 -4,036.20 2,962.50 -5,926.70 12,130.20 Repayments of revolving credit facility -6.1 -159.8 -11.8 Proceeds from revolving credit facility 140 Proceeds from stock issued pursuant to stock-based compensation plans -140 Cash paid for taxes on exerciseslvesting of stook-based compensation Tax benefit of exeroisesivesting of stook-based compensation 41.5 13.9 -22.2 Net cash provided by (used in) financing activities -21.6 12.8 Effect of exchange rate changes on cash and cash equivalents -1,060.50 6,048.80 -30.6 Net increase (decrease) in cash and cash equivalents 1.1 -0.9 -0.8 Cash and cash equivalents at beginning of year 130.3 -128 596.4 Cash and cash equivalents at end of year 736.1 864.1 267.7 Supplemental disclosure of cash flow information: 866.4 $ 736.1 $ 864.1 Cash paid for: Interest, net of amounts capitalized Income taxes 329.1 $ 487 $ 33.9 Non-cash transactions: Accrued capital expenditures 501.8 $ 138.4 $ 3723 Acquisition cost paid in common stock and equity compensation 30.3 $ 72.4 $ 19.7 See accompanying Notes to Consolidated Financial Statements - $ 2.290.10 $ Company Cash Flow Statement from EDGAR DOLLAR GENERAL CORPORATION AND SUBSIDIARIES CONDENSED CONSOLIDATED STATEMENTS OF CASH FLOWS (Unaudited) (In thousands) For the Year Ended January 29, 2017 January 30. 2016 January 31. 2015 1,165,080 1,065,345 1,025,116 342 353 -17,734 ) -12,147) Cash flows from operating activities: Net income Adjustments to reconcile net income to net cash from operating activities: Depreciation and amortization Deferred income taxes Tax benefit of share based awards Loss on debt retirement, net Noncash share-based compensation Other noncash (gains) and losses Change in operating assets and liabilities. Merchandise inventories Prepaid expenses and other current assets Accounts payable Accrued expenses and other liabilities Income taxes Other 352.431 12.126 -13,698 ) 326 38,547 7.797 332,837 -36,851 ) 30,990 ) 18,871 20,961 -12,747) 37,338 8.551 -290,001) -24,626 ) 105,637 44949 -19,675 ) (905) -233,559 ) 25.048) 97,166 41,635 12,399 -1,555 ) -144.943) 4,947) 36,942 16,265 -5,249 ) -2,200 ) Net cash provided by (used in) operating activities 1,377,988 1,314,744 1,213,065 Cash flows from investing activities: Purchases of property and equipment Proceeds from sales of property and equipment -504,806 ) 1.423 373,967 ) 2.268 -538,444) 288,466 Net cash provided by (used in) investing activities 503,383 ) 371,699 ) 249.978 ) Cashflows from financing activities: Issuance of long-term obligations Repayments of long-term obligations Borrowings under revolving credit facilities Repayments of borrowings under revolving credit facilities Debt issuance costs Payments for cash flow hedge related to debt issuance Repurchases of common stock Payments of cash dividends Other equity and related transactions Tax benefit of share-based awards 499 220 -502,401 ) 2,034,100 -1,783,100 ) -6.991) 78,467 ) 1,023,000 1,023,000) 2,297,177 -2,119,991 ) 1,172,900 -1,303,800 ) -15,996 ) -13,217 ) -620,052) 800,095 ) -1,299,613 ) -258,328 ) 6,934 13,698 2,373 ) 12,147 -26,341 ) 30,990 Net cash provided by (used in) financing activities -1,296,481 ) -868,788) -598,330) Net increase (decrease) in cash and cash equivalents Cash and cash equivalents, beginning of year 421,876) 579,823 364,757 140,809 505,566 Cash and cash equivalents, end of year 157.947 579,823 505,566 $ $ Supplemental cash flow information: Cash paid for Interest Income taxes Supplemental schedule of noncash investing and financing activities: Purchases of property and equipment awaiting processing for payment included in Accounts payable 76 354 697,357 82.447 631,483 73,464 646,811 32,020 31,586 S 27,082 Dollar Tree 2015 Dollar General 2015 2014 2014 Valuation P/E P/CF P/S P/B aka market-to-book ratio Basic EPS Diluted EPS EBITDA per share Dividends per share Dividend payout ratio Retention ratio aka b Sustainable growth rate price per share/earnings per share price per share/cash flow per share price per share/sales per share price per share/book value per share Net income-preferred dividends/Weighted avg number of ordinary shares outstanding Net income - preferred dividends/diluted shares outstanding EBITDA/avg # shares outstanding common dividends declared/weighted number of shares outstanding common dividends / Net income attributed to common shares 1 - dividend payout ratio retention ratio * ROE DOLLAR TREE, INC. CONSOLIDATED STATEMENTS OF CASH FLOWS (in millions) Cash flows from operating activities: Year Ended January 30, 2016 January 28, 2017 Net income January 31, 2015 Adjustments to reconcile net income to net cash provided by operating activities: 896.2 $ 282.4 $ 599.2 Depreciation and amortization Provision for deferred income taxes 637.5 487.6 205.9 Stock-based compensation expense -124.1 25.6 -18.1 Amortization of debt discount and debt-issuance costs 61.6 53.2 38.3 Other non-cash adjustments to net income 55.2 64.7 Changes in assets and liabilities increasing (decreasing) cash and cash equivalents: Merchandise inventories Prepaids and other current assets 21.9 -87.8 Accounts payable 117.2 -63.5 Income taxes payable -133.8 183.9 41.9 Other current liabilities 77.1 3.1 -4.6 Other liabilities 30.4 -164.1 87.5 Net cash provided by operating activities 24.7 Cash flows from investing activities: 1,673.30 802.5 942.8 Capital expenditures Acquisition of Family Dollar, net of common stock issued, equity compensation and oash acquired Purchase of restricted cash and investments -564.7 -480.5 -325.6 Proceeds from sale of restricted investments -6,527.70 -36.1 -6.8 Proceeds from (payments for) fixed asset disposition -23.7 53 118.1 15.8 Net cash used in investing activities Cash flows from financing activities: 0.9 0.5 1.6 483.6 -6,978,40 -315 Principal payments for long-term debt Proceeds from long-term debt, net of discount Debt-issuance costs -12.8 -4,036.20 2,962.50 -5,926.70 12,130.20 Repayments of revolving credit facility -6.1 -159.8 -11.8 Proceeds from revolving credit facility 140 Proceeds from stock issued pursuant to stock-based compensation plans -140 Cash paid for taxes on exerciseslvesting of stook-based compensation Tax benefit of exeroisesivesting of stook-based compensation 41.5 13.9 -22.2 Net cash provided by (used in) financing activities -21.6 12.8 Effect of exchange rate changes on cash and cash equivalents -1,060.50 6,048.80 -30.6 Net increase (decrease) in cash and cash equivalents 1.1 -0.9 -0.8 Cash and cash equivalents at beginning of year 130.3 -128 596.4 Cash and cash equivalents at end of year 736.1 864.1 267.7 Supplemental disclosure of cash flow information: 866.4 $ 736.1 $ 864.1 Cash paid for: Interest, net of amounts capitalized Income taxes 329.1 $ 487 $ 33.9 Non-cash transactions: Accrued capital expenditures 501.8 $ 138.4 $ 3723 Acquisition cost paid in common stock and equity compensation 30.3 $ 72.4 $ 19.7 See accompanying Notes to Consolidated Financial Statements - $ 2.290.10 $ Company Cash Flow Statement from EDGAR DOLLAR GENERAL CORPORATION AND SUBSIDIARIES CONDENSED CONSOLIDATED STATEMENTS OF CASH FLOWS (Unaudited) (In thousands) For the Year Ended January 29, 2017 January 30. 2016 January 31. 2015 1,165,080 1,065,345 1,025,116 342 353 -17,734 ) -12,147) Cash flows from operating activities: Net income Adjustments to reconcile net income to net cash from operating activities: Depreciation and amortization Deferred income taxes Tax benefit of share based awards Loss on debt retirement, net Noncash share-based compensation Other noncash (gains) and losses Change in operating assets and liabilities. Merchandise inventories Prepaid expenses and other current assets Accounts payable Accrued expenses and other liabilities Income taxes Other 352.431 12.126 -13,698 ) 326 38,547 7.797 332,837 -36,851 ) 30,990 ) 18,871 20,961 -12,747) 37,338 8.551 -290,001) -24,626 ) 105,637 44949 -19,675 ) (905) -233,559 ) 25.048) 97,166 41,635 12,399 -1,555 ) -144.943) 4,947) 36,942 16,265 -5,249 ) -2,200 ) Net cash provided by (used in) operating activities 1,377,988 1,314,744 1,213,065 Cash flows from investing activities: Purchases of property and equipment Proceeds from sales of property and equipment -504,806 ) 1.423 373,967 ) 2.268 -538,444) 288,466 Net cash provided by (used in) investing activities 503,383 ) 371,699 ) 249.978 ) Cashflows from financing activities: Issuance of long-term obligations Repayments of long-term obligations Borrowings under revolving credit facilities Repayments of borrowings under revolving credit facilities Debt issuance costs Payments for cash flow hedge related to debt issuance Repurchases of common stock Payments of cash dividends Other equity and related transactions Tax benefit of share-based awards 499 220 -502,401 ) 2,034,100 -1,783,100 ) -6.991) 78,467 ) 1,023,000 1,023,000) 2,297,177 -2,119,991 ) 1,172,900 -1,303,800 ) -15,996 ) -13,217 ) -620,052) 800,095 ) -1,299,613 ) -258,328 ) 6,934 13,698 2,373 ) 12,147 -26,341 ) 30,990 Net cash provided by (used in) financing activities -1,296,481 ) -868,788) -598,330) Net increase (decrease) in cash and cash equivalents Cash and cash equivalents, beginning of year 421,876) 579,823 364,757 140,809 505,566 Cash and cash equivalents, end of year 157.947 579,823 505,566 $ $ Supplemental cash flow information: Cash paid for Interest Income taxes Supplemental schedule of noncash investing and financing activities: Purchases of property and equipment awaiting processing for payment included in Accounts payable 76 354 697,357 82.447 631,483 73,464 646,811 32,020 31,586 S 27,082 Dollar Tree 2015 Dollar General 2015 2014 2014 Valuation P/E P/CF P/S P/B aka market-to-book ratio Basic EPS Diluted EPS EBITDA per share Dividends per share Dividend payout ratio Retention ratio aka b Sustainable growth rate price per share/earnings per share price per share/cash flow per share price per share/sales per share price per share/book value per share Net income-preferred dividends/Weighted avg number of ordinary shares outstanding Net income - preferred dividends/diluted shares outstanding EBITDA/avg # shares outstanding common dividends declared/weighted number of shares outstanding common dividends / Net income attributed to common shares 1 - dividend payout ratio retention ratio * ROE

 Solve for the ratios of both companies. Pretend that 2018 is 2015 and 2017 is 2014


