Solve for yellow highlighted cells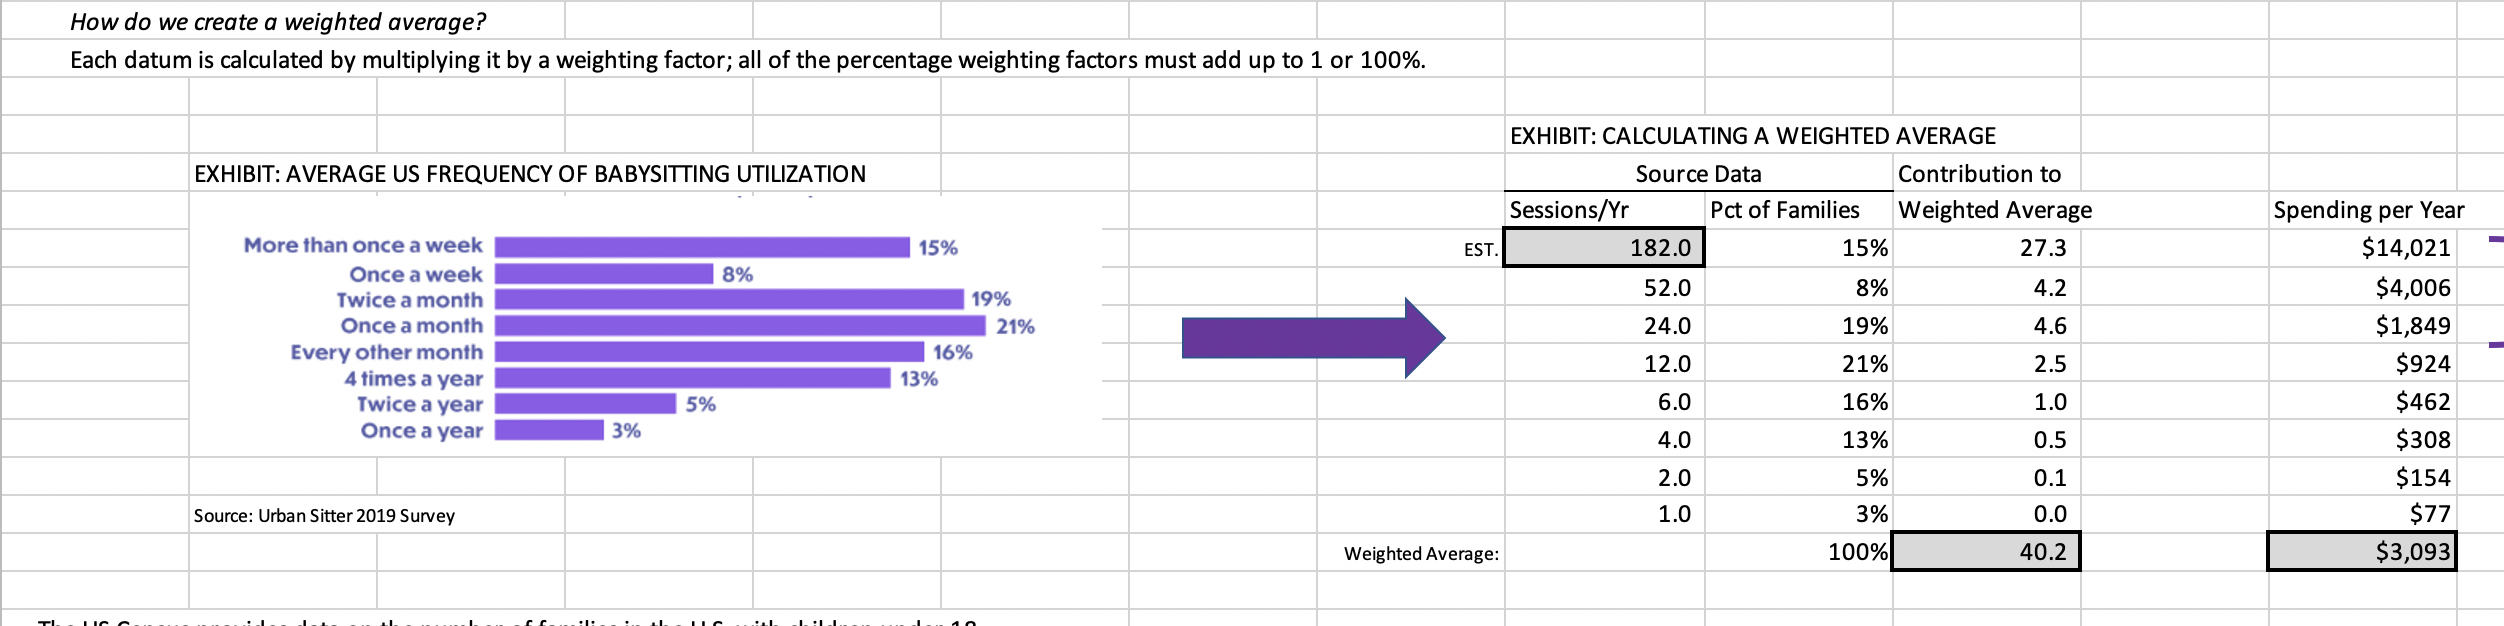

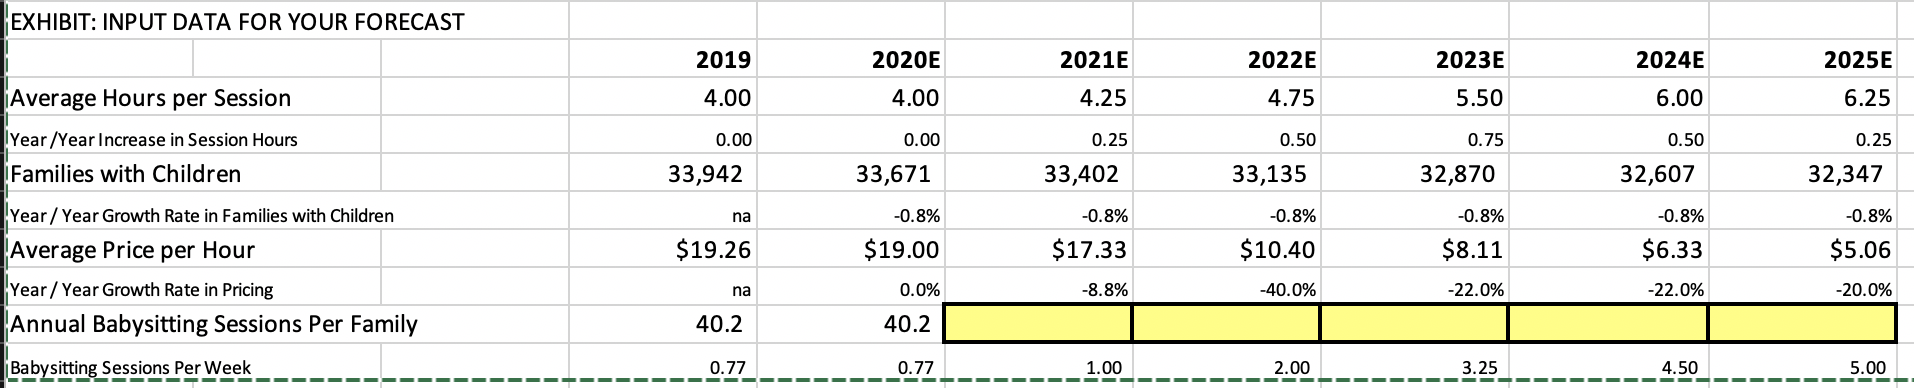
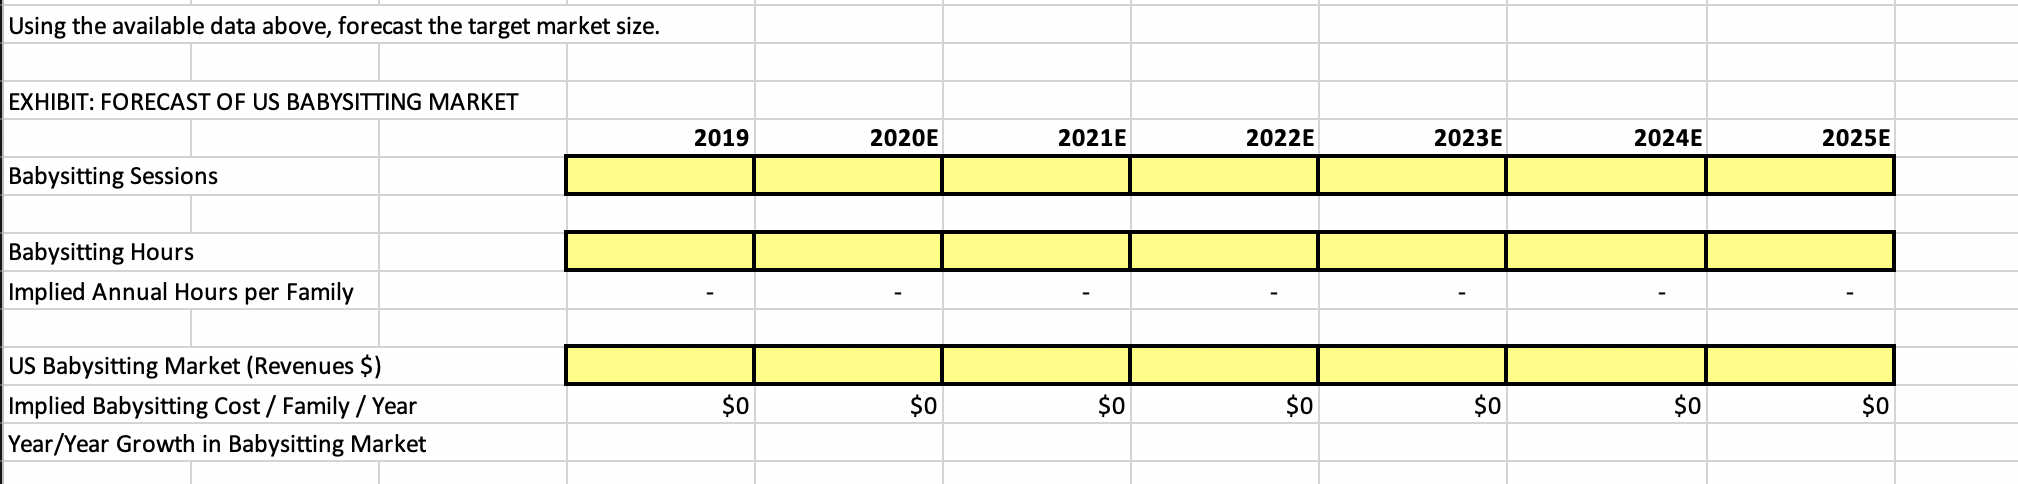
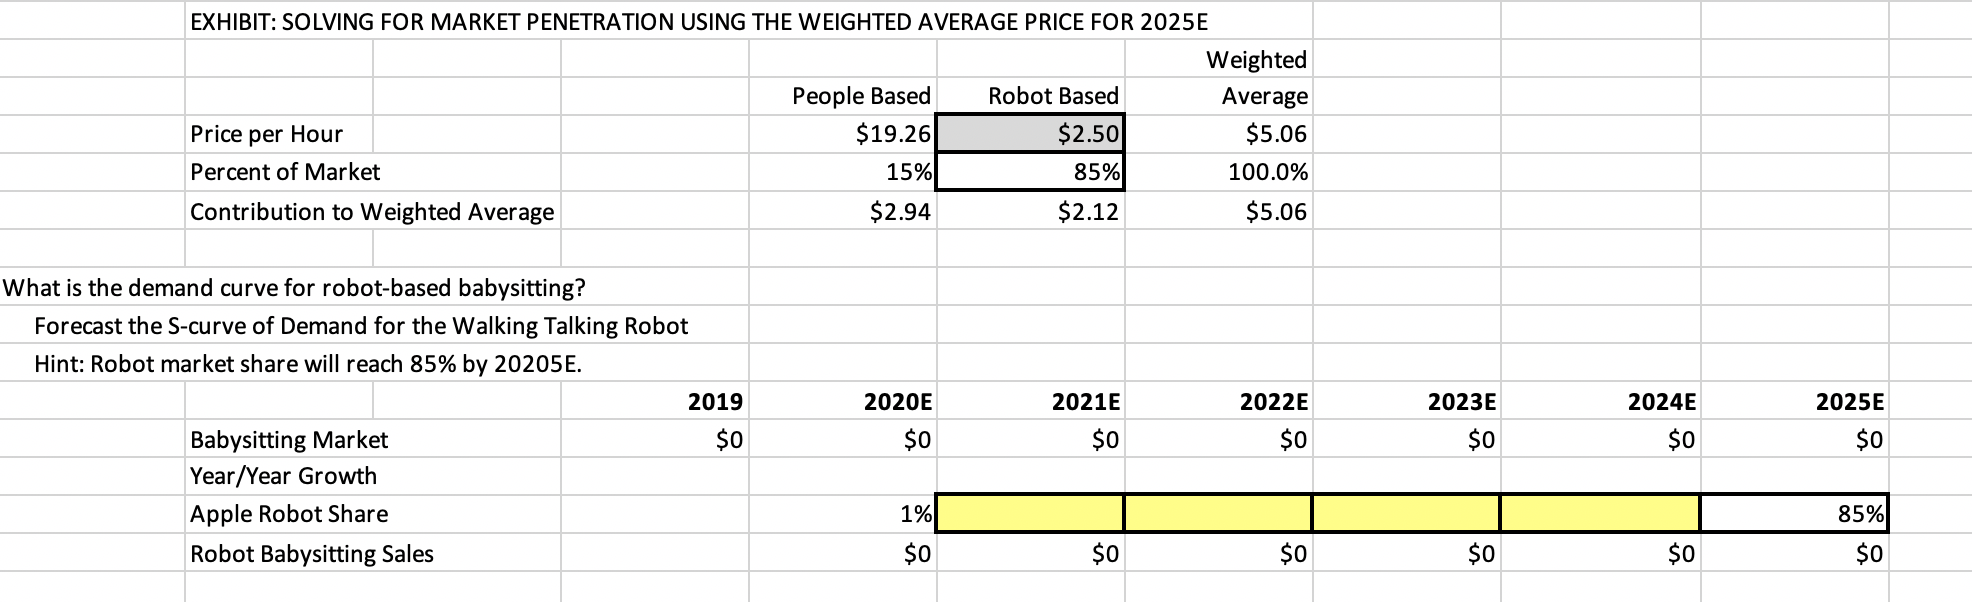
How do we create a weighted average? Each datum is calculated by multiplying it by a weighting factor; all of the percentage weighting factors must add up to 1 or 100%. EXHIBIT: AVERAGE US FREQUENCY OF BABYSITTING UTILIZATION EXHIBIT: CALCULATING A WEIGHTED AVERAGE Source Data Contribution to Sessions/Yr Pct of Families Weighted Average 182.0 15% 27.3 15% EST. 182.0 8% Spending per Year $14,021 $4,006 $1,849 52.0 4.2 19% 21% 8% 19% 24.0 4.6 More than once a week Once a week Twice a month Once a month Every other month 4 times a year Twice a year Once a year 16% 13% 12.0 21% 2.5 $924 5% 6.0 16% 1.0 3% 0.5 4.0 2.0 1.0 0.1 13% 5% 3% 100% $462 $308 $154 $77 $3,093 Source: Urban Sitter 2019 Survey 0.0 Weighted Average: 40.2 TI 2009 2010 2011 2013 2014 2015 2016 2017 2019 2012 34,989 2018 34,452 35,365 35,218 35,060 35,058 34,955 34,979 34,769 34,292 Families with Children Children per Family Source: US Census 33,942 1.93 16 - 19 -0.8% 0.7% 14 - 19 -0.6% 0.3% 1.86 1.88 1.87 1.88 1.88 1.90 1.86 1.89 1.90 1.90 From the analysis above, we can formulate assumptions that will generate the data for our forecast. EXHIBIT: INPUT DATA FOR YOUR FORECAST 2019 2022E 2023E 2020E 4.00 2021E 4.25 2024E 6.00 2025E 6.25 Average Hours per Session 4.00 4.75 5.50 0.00 0.25 0.50 Year/Year Increase in Session Hours Families with Children 0.00 33,942 0.75 32,870 0.50 32,607 0.25 32,347 33,671 33,402 33,135 na -0.8% $17.33 -0.8% $10.40 -0.8% $8.11 -0.8% $6.33 -0.8% $5.06 Year / Year Growth Rate in Families with Children -0.8% Average Price per Hour $19.26 $19.00 Year/ Year Growth Rate in Pricing 0.0% Annual Babysitting Sessions Per Family 40.2 40.2 Babysitting Sessions Per Week -------------------------0.77--------0.77 na -8.8% -40.0% -22.0% -22.0% -20.0% 0.77 -------1.00 ------- 2.00 -------3.25 --------4.50 ------- 5.00 4.50 - - - Using the available data above, forecast the target market size. EXHIBIT: FORECAST OF US BABYSITTING MARKET 2019 2020 2021 2022 2023 2024 2025E Babysitting Sessions Babysitting Hours Implied Annual Hours per Family US Babysitting Market (Revenues $) Implied Babysitting Cost / Family / Year Year/Year Growth in Babysitting Market So $0 So $0 EXHIBIT: SOLVING FOR MARKET PENETRATION USING THE WEIGHTED AVERAGE PRICE FOR 2025E Weighted People Based Robot Based Average Price per Hour $19.26 $2.50 $5.06 Percent of Market 15% 85% 100.0% Contribution to Weighted Average $2.94 $2.12 $5.06 What is the demand curve for robot-based babysitting? Forecast the S-curve of Demand for the Walking Talking Robot Hint: Robot market share will reach 85% by 20205E. 2019 2020E 2024E 2021E $0 2022E $0 2023E $0 2025E $0 $0 $0 $0 Babysitting Market Year/Year Growth Apple Robot Share Robot Babysitting Sales 1% 85% $0 $0 $0 $0 $0 $0 How do we create a weighted average? Each datum is calculated by multiplying it by a weighting factor; all of the percentage weighting factors must add up to 1 or 100%. EXHIBIT: AVERAGE US FREQUENCY OF BABYSITTING UTILIZATION EXHIBIT: CALCULATING A WEIGHTED AVERAGE Source Data Contribution to Sessions/Yr Pct of Families Weighted Average 182.0 15% 27.3 15% EST. 182.0 8% Spending per Year $14,021 $4,006 $1,849 52.0 4.2 19% 21% 8% 19% 24.0 4.6 More than once a week Once a week Twice a month Once a month Every other month 4 times a year Twice a year Once a year 16% 13% 12.0 21% 2.5 $924 5% 6.0 16% 1.0 3% 0.5 4.0 2.0 1.0 0.1 13% 5% 3% 100% $462 $308 $154 $77 $3,093 Source: Urban Sitter 2019 Survey 0.0 Weighted Average: 40.2 TI 2009 2010 2011 2013 2014 2015 2016 2017 2019 2012 34,989 2018 34,452 35,365 35,218 35,060 35,058 34,955 34,979 34,769 34,292 Families with Children Children per Family Source: US Census 33,942 1.93 16 - 19 -0.8% 0.7% 14 - 19 -0.6% 0.3% 1.86 1.88 1.87 1.88 1.88 1.90 1.86 1.89 1.90 1.90 From the analysis above, we can formulate assumptions that will generate the data for our forecast. EXHIBIT: INPUT DATA FOR YOUR FORECAST 2019 2022E 2023E 2020E 4.00 2021E 4.25 2024E 6.00 2025E 6.25 Average Hours per Session 4.00 4.75 5.50 0.00 0.25 0.50 Year/Year Increase in Session Hours Families with Children 0.00 33,942 0.75 32,870 0.50 32,607 0.25 32,347 33,671 33,402 33,135 na -0.8% $17.33 -0.8% $10.40 -0.8% $8.11 -0.8% $6.33 -0.8% $5.06 Year / Year Growth Rate in Families with Children -0.8% Average Price per Hour $19.26 $19.00 Year/ Year Growth Rate in Pricing 0.0% Annual Babysitting Sessions Per Family 40.2 40.2 Babysitting Sessions Per Week -------------------------0.77--------0.77 na -8.8% -40.0% -22.0% -22.0% -20.0% 0.77 -------1.00 ------- 2.00 -------3.25 --------4.50 ------- 5.00 4.50 - - - Using the available data above, forecast the target market size. EXHIBIT: FORECAST OF US BABYSITTING MARKET 2019 2020 2021 2022 2023 2024 2025E Babysitting Sessions Babysitting Hours Implied Annual Hours per Family US Babysitting Market (Revenues $) Implied Babysitting Cost / Family / Year Year/Year Growth in Babysitting Market So $0 So $0 EXHIBIT: SOLVING FOR MARKET PENETRATION USING THE WEIGHTED AVERAGE PRICE FOR 2025E Weighted People Based Robot Based Average Price per Hour $19.26 $2.50 $5.06 Percent of Market 15% 85% 100.0% Contribution to Weighted Average $2.94 $2.12 $5.06 What is the demand curve for robot-based babysitting? Forecast the S-curve of Demand for the Walking Talking Robot Hint: Robot market share will reach 85% by 20205E. 2019 2020E 2024E 2021E $0 2022E $0 2023E $0 2025E $0 $0 $0 $0 Babysitting Market Year/Year Growth Apple Robot Share Robot Babysitting Sales 1% 85% $0 $0 $0 $0 $0 $0