Answered step by step
Verified Expert Solution
Question
1 Approved Answer
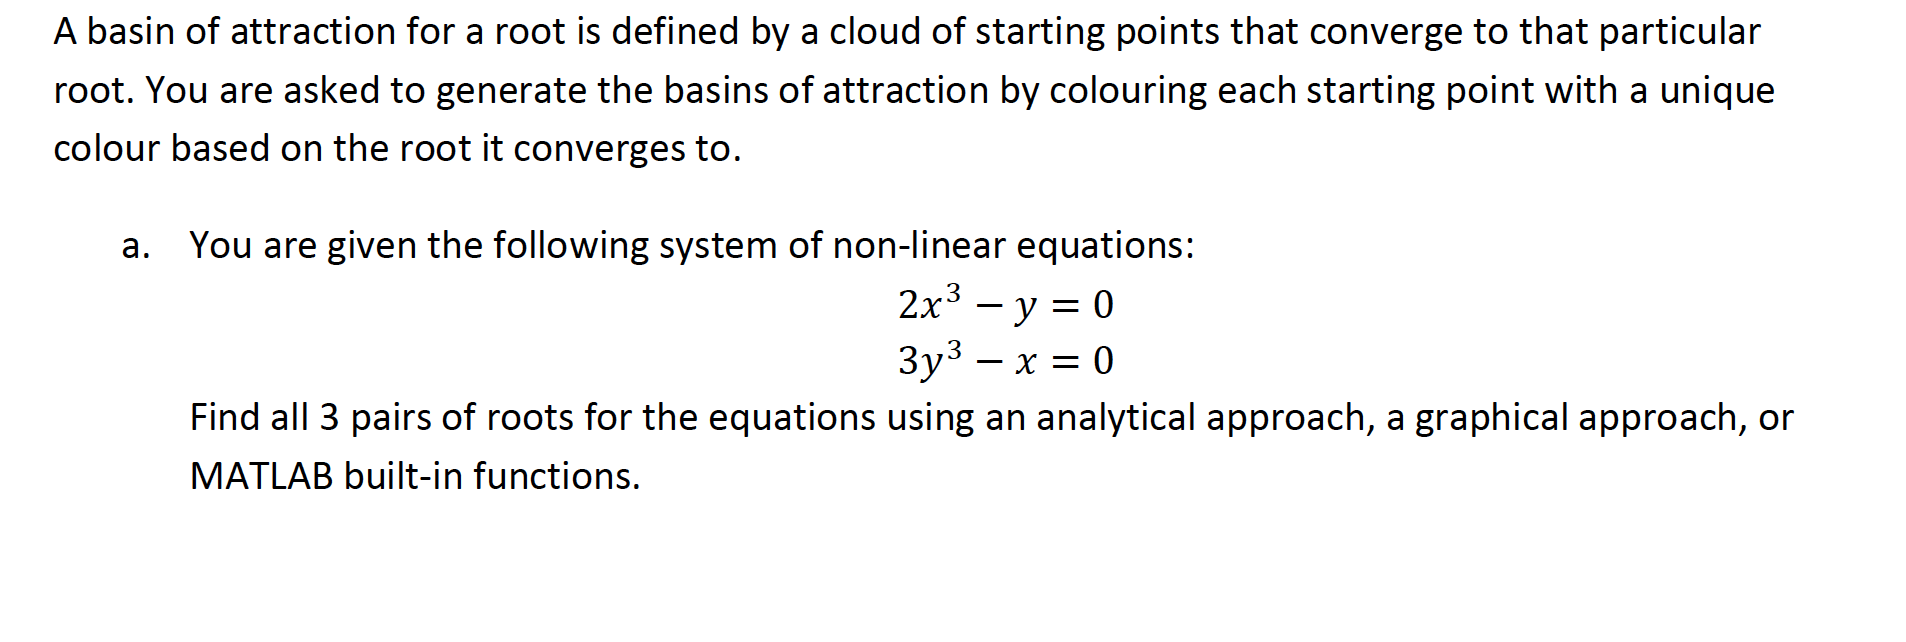
SOLVE IN MATLAB AND SHOW CODE PLEASE A basin of attraction for a root is defined by a cloud of starting points that converge to


SOLVE IN MATLAB AND SHOW CODE PLEASE
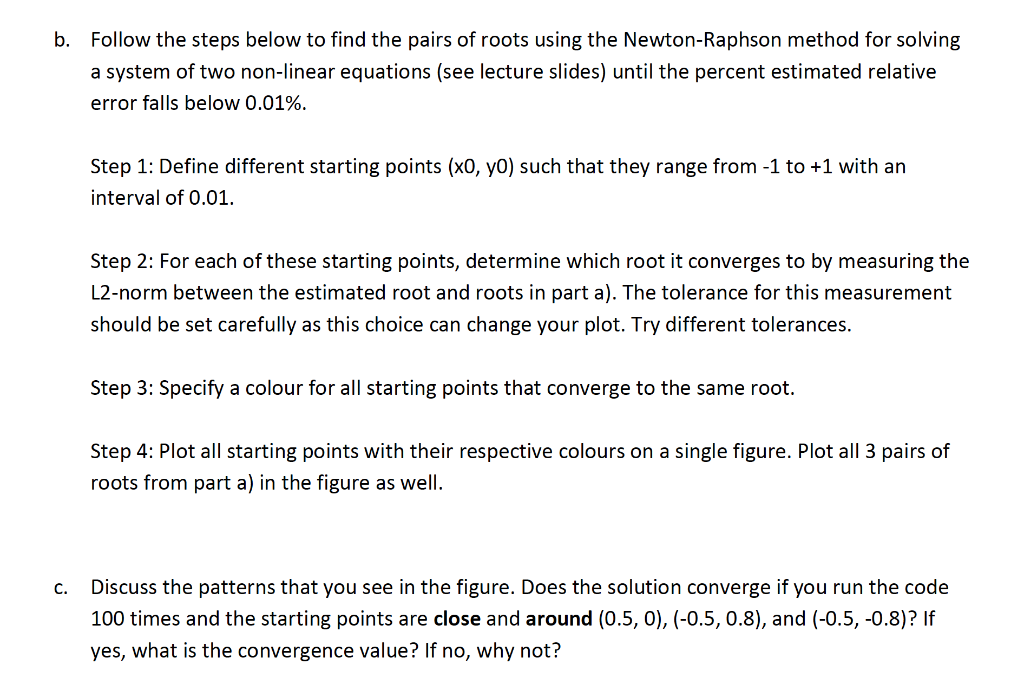
A basin of attraction for a root is defined by a cloud of starting points that converge to that particular root. You are asked to generate the basins of attraction by colouring each starting point with a unique colour based on the root it converges to. a. You are given the following system of non-linear equations: 2x3 y = 0 3y3 x = 0 Find all 3 pairs of roots for the equations using an analytical approach, a graphical approach, or MATLAB built-in functions. b. Follow the steps below to find the pairs of roots using the Newton-Raphson method for solving a system of two non-linear equations (see lecture slides) until the percent estimated relative error falls below 0.01%. Step 1: Define different starting points (XO, yo) such that they range from -1 to +1 with an interval of 0.01. Step 2: For each of these starting points, determine which root it converges to by measuring the L2-norm between the estimated root and roots in part a). The tolerance for this measurement should be set carefully as this choice can change your plot. Try different tolerances. Step 3: Specify a colour for all starting points that converge to the same root. Step 4: Plot all starting points with their respective colours on a single figure. Plot all 3 pairs of roots from part a) in the figure as well. c. Discuss the patterns that you see in the figure. Does the solution converge if you run the code 100 times and the starting points are close and around (0.5, 0), (-0.5, 0.8), and (-0.5, -0.8)? If yes, what is the convergence value? If no, why not? A basin of attraction for a root is defined by a cloud of starting points that converge to that particular root. You are asked to generate the basins of attraction by colouring each starting point with a unique colour based on the root it converges to. a. You are given the following system of non-linear equations: 2x3 y = 0 3y3 x = 0 Find all 3 pairs of roots for the equations using an analytical approach, a graphical approach, or MATLAB built-in functions. b. Follow the steps below to find the pairs of roots using the Newton-Raphson method for solving a system of two non-linear equations (see lecture slides) until the percent estimated relative error falls below 0.01%. Step 1: Define different starting points (XO, yo) such that they range from -1 to +1 with an interval of 0.01. Step 2: For each of these starting points, determine which root it converges to by measuring the L2-norm between the estimated root and roots in part a). The tolerance for this measurement should be set carefully as this choice can change your plot. Try different tolerances. Step 3: Specify a colour for all starting points that converge to the same root. Step 4: Plot all starting points with their respective colours on a single figure. Plot all 3 pairs of roots from part a) in the figure as well. c. Discuss the patterns that you see in the figure. Does the solution converge if you run the code 100 times and the starting points are close and around (0.5, 0), (-0.5, 0.8), and (-0.5, -0.8)? If yes, what is the convergence value? If no, why notStep by Step Solution
There are 3 Steps involved in it
Step: 1

Get Instant Access to Expert-Tailored Solutions
See step-by-step solutions with expert insights and AI powered tools for academic success
Step: 2

Step: 3

Ace Your Homework with AI
Get the answers you need in no time with our AI-driven, step-by-step assistance
Get Started


