Answered step by step
Verified Expert Solution
Link Copied!

Question

1 Approved Answer

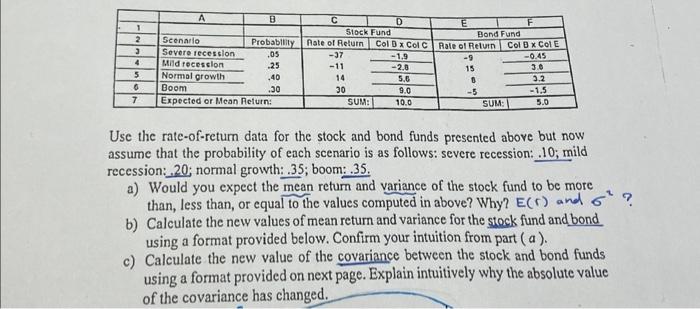
solve it with clear steps please Use the rate-of-return data for the stock and bond funds presented above but now assume that the probability of

solve it with clear steps please
image text in transcribed
Use the rate-of-return data for the stock and bond funds presented above but now assume that the probability of each scenario is as follows: severe recession: .10; mild recession: .20; normal growth: . 35 ; boom: .35 . a) Would you expect the mean return and variance of the stock fund to be more than, less than, or equal to the values computed in above? Why? b) Calculate the new values of mean return and variance for the stock fund and bond using a format provided below. Confirm your intuition from part (a). c) Calculate the new value of the covariance between the stock and bond funds using a format provided on next page. Explain intuitively why the absolute value of the covariance has changed. Use the rate-of-return data for the stock and bond funds presented above but now assume that the probability of each scenario is as follows: severe recession: 10 ; mild recession: 20 ; normal growth: .35 ; boom: .35 . a) Would you expect the mean return and variance of the stock fund to be more than, less than, or equal to the values computed in above? Why? E(r) and 2 ? b) Calculate the new values of mean return and variance for the stock fund and bond using a format provided below. Confirm your intuition from part (a). c) Calculate the new value of the covariance between the stock and bond funds using a format provided on next page. Explain intuitively why the absolute value of the covariance has changed

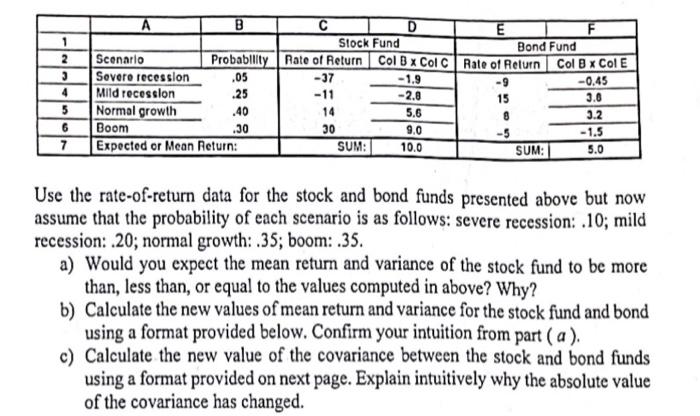
Step by Step Solution

There are 3 Steps involved in it

Step: 1

blur-text-image

Get Instant Access to Expert-Tailored Solutions

See step-by-step solutions with expert insights and AI powered tools for academic success

Step: 2

blur-text-image

Step: 3

blur-text-image

Ace Your Homework with AI

Get the answers you need in no time with our AI-driven, step-by-step assistance

Get Started

Recommended Textbook for

Applied Equity Analysis and Portfolio Management Tools to Analyze and Manage Your Stock Portfolio

Authors: Robert A.Weigand

1st edition

978-111863091, 1118630912, 978-1118630914

More Books

Students also viewed these Finance questions

Question

Q.No.1 Explain Large scale map ? Q.No.2 Explain small scale map ?

Answered: 1 week ago

Question

1. Signs and symbols of the map Briefly by box ?

Answered: 1 week ago