

Question
solve only one its ok! ((( using matlab ))) >>> the previous code is : fs=100; b=3; >> fa=10; >> x=linspace(0,t,n); y=sin(2*pi*fa*x); >> yq=round(y*2^(b-1))/2^(b-1); >>
solve only one its ok!
((( using matlab )))
>>> the previous code is :
fs=100;
b=3;
>> fa=10;
>> x=linspace(0,t,n);
y=sin(2*pi*fa*x);
>> yq=round(y*2^(b-1))/2^(b-1);
>> plot(x,y)
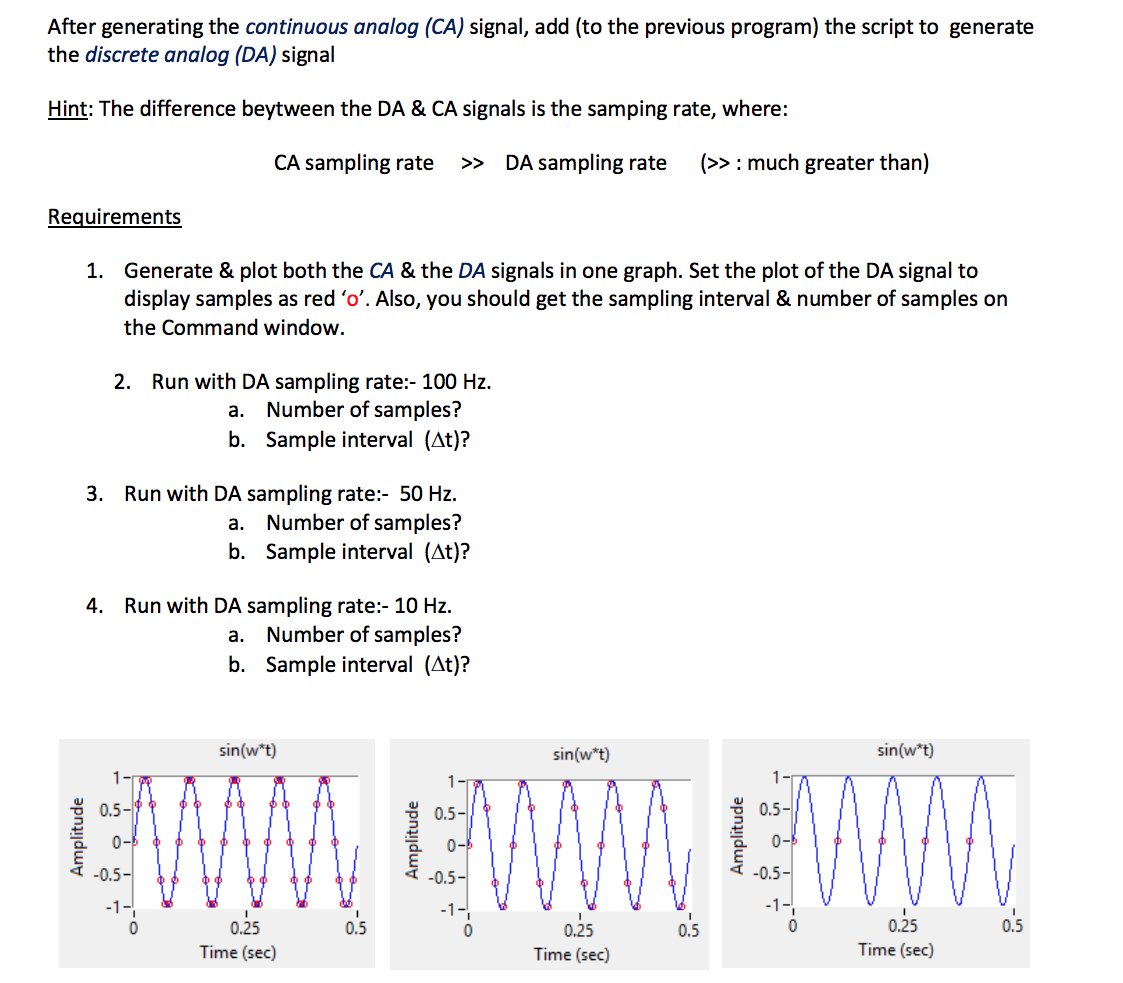
After generating the continuous analog (CA) signal, add to the previous program) the script to generate the discrete analog (DA) signal Hint: The difference beytween the DA & CA signals is the samping rate, where: CA sampling rate >> DA sampling rate >>: much greater than) Requirements 1. Generate & plot both the CA & the DA signals in one graph. Set the plot of the DA signal to display samples as red 'o'. Also, you should get the sampling interval & number of samples on the Command window. 2. Run with DA sampling rate:- 100 Hz. a. Number of samples? b. Sample interval (At)? 3. Run with DA sampling rate:- 50 Hz. a. Number of samples? b. Sample interval (At)? 4. Run with DA sampling rate:- 10 Hz. a. Number of samples? b. Sample interval (At)? sin(w*t) sin(w*t) sin(w*t) 1- 0.5- Amplitude Amplitude 1 1 0 Amplitude 0 -0.5- 0 0 - 0.5 0.25 Time (sec) 0.25 Time (sec) 0.25 Time (sec) After generating the continuous analog (CA) signal, add to the previous program) the script to generate the discrete analog (DA) signal Hint: The difference beytween the DA & CA signals is the samping rate, where: CA sampling rate >> DA sampling rate >>: much greater than) Requirements 1. Generate & plot both the CA & the DA signals in one graph. Set the plot of the DA signal to display samples as red 'o'. Also, you should get the sampling interval & number of samples on the Command window. 2. Run with DA sampling rate:- 100 Hz. a. Number of samples? b. Sample interval (At)? 3. Run with DA sampling rate:- 50 Hz. a. Number of samples? b. Sample interval (At)? 4. Run with DA sampling rate:- 10 Hz. a. Number of samples? b. Sample interval (At)? sin(w*t) sin(w*t) sin(w*t) 1- 0.5- Amplitude Amplitude 1 1 0 Amplitude 0 -0.5- 0 0 - 0.5 0.25 Time (sec) 0.25 Time (sec) 0.25 Time (sec)Step by Step Solution
There are 3 Steps involved in it
Step: 1

Get Instant Access to Expert-Tailored Solutions
See step-by-step solutions with expert insights and AI powered tools for academic success
Step: 2

Step: 3
Ace Your Homework with AI
Get the answers you need in no time with our AI-driven, step-by-step assistance
Get Started
Intelligent Information And Database Systems 6th Asian Conference Aciids 2014 Bangkok Thailand April 7 9 2014 Proceedings Part I 9 2014 Proceedings Part 1 Lnai 8397
Authors: Ngoc-Thanh Nguyen ,Boonwat Attachoo ,Bogdan Trawinski ,Kulwadee Somboonviwat
2014th Edition
3319054759, 978-3319054759