

Question
Solve only PART 2. Please write down the changes of any line and provide the number of the line. %%%%%%%%%%%%%%%%%%%%%%%%%%%%%%%% % adjust the following (READ
Solve only PART 2. 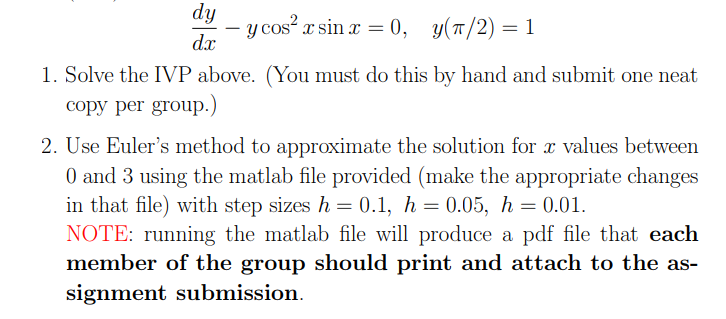
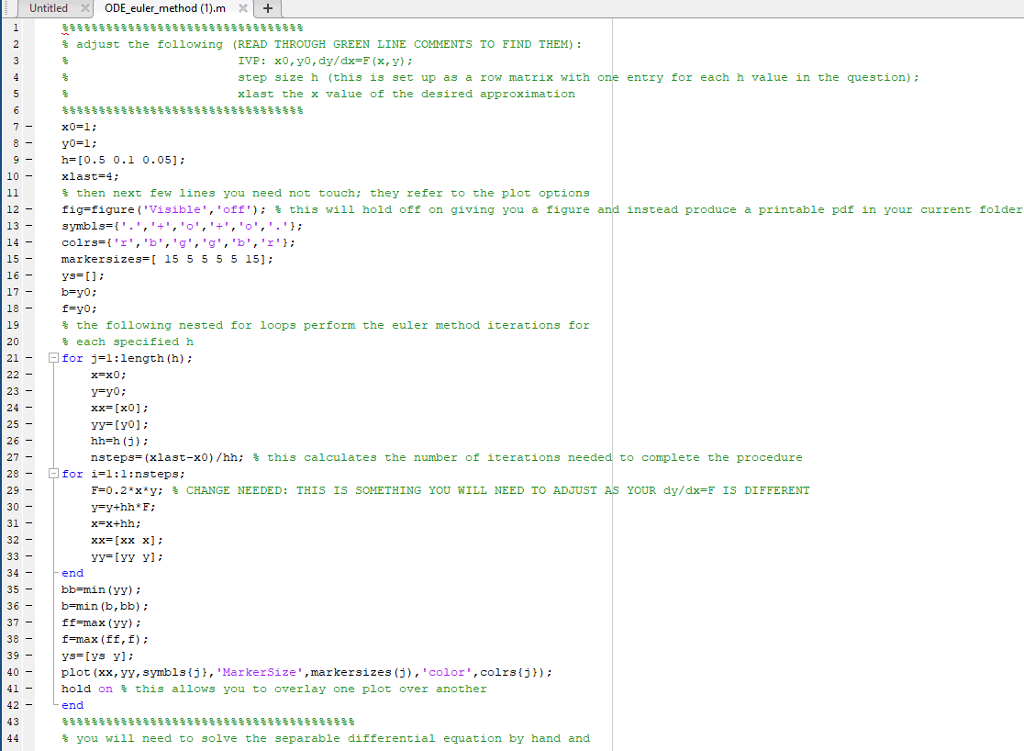
 Please write down the changes of any line and provide the number of the line.
%%%%%%%%%%%%%%%%%%%%%%%%%%%%%%%%
% adjust the following (READ THROUGH GREEN LINE COMMENTS TO FIND THEM):
% IVP: x0,y0,dy/dx=F(x,y);
% step size h (this is set up as a row matrix with one entry for each h value in the question);
% xlast the x value of the desired approximation
%%%%%%%%%%%%%%%%%%%%%%%%%%%%%%%%%
x0=1;
y0=1;
h=[0.5 0.1 0.05];
xlast=4;
% then next few lines you need not touch; they refer to the plot options
fig=figure('Visible','off'); % this will hold off on giving you a figure and instead produce a printable pdf in your current folder
symbls={'.','+','o','+','o','.'};
colrs={'r','b','g','g','b','r'};
markersizes=[ 15 5 5 5 5 15];
ys=[];
b=y0;
f=y0;
% the following nested for loops perform the euler method iterations for
% each specified h
for j=1:length(h);
x=x0;
y=y0;
xx=[x0];
yy=[y0];
hh=h(j);
nsteps=(xlast-x0)/hh; % this calculates the number of iterations needed to complete the procedure
for i=1:1:nsteps;
F=0.2*x*y; % CHANGE NEEDED: THIS IS SOMETHING YOU WILL NEED TO ADJUST AS YOUR dy/dx=F IS DIFFERENT
y=y+hh*F;
x=x+hh;
xx=[xx x];
yy=[yy y];
end
bb=min(yy);
b=min(b,bb);
ff=max(yy);
f=max(ff,f);
ys=[ys y];
plot(xx,yy,symbls{j},'MarkerSize',markersizes(j),'color',colrs{j});
hold on % this allows you to overlay one plot over another
end
%%%%%%%%%%%%%%%%%%%%%%%%%%%%%%%%%%%%%%%%
% you will need to solve the separable differential equation by hand and
% input here your solution as a formula on x: y=...
%%%%%%%%%%%%%%%%%%%%%%%%%%%%%%%%%%%%%%%%
x=x0:0.01:xlast;
y=exp(0.1*(x.^2-1)); % CHANGE NEEDED: your EXACT solution SHOULD BE SUBBED IN HERE
actual=y(length(y)) % shows off only in your command window
approx=[h; ys] % shows off only in command window; first row is h value, underneath is corresponding ylast approximation
plot(x,y,'LineWidth',2,'color','k');
hold off
% the following lines will just adjust plot options -- viewing box, labels
axis tight;
xlabel 'x', ylabel 'y';
a=min(y);
c=min(a,b);
e=max(y);
d=max(e,f);
xlim([x0 xlast]);
ylim([c-.5 d+.5]);
legend('Euler with h=0.5','Euler with h=0.1','Euler with h=0.05','Exact Solution'); % CHANGE NEEDED if your step sizes are different
title 'MATH2860Assignment 1, FALL2013, your ta name, your name'; % CHANGE NEEDED: this title needs to be changed
%%%%%%%%%%%%%%%%%%%%%%%%%%%%%%%%%%%%%%%%
% the following 4 lines creat a pdf (in your current folder) with the name
% MATH2860Assignment1 you can print and submit as part of your assignment
%%%%%%%%%%%%%%%%%%%%%%%%%%%%%%%%%%%%%%%%
set(fig,'PaperOrientation','landscape');
set(fig,'PaperUnits','normalized');
set(fig,'PaperPosition', [0 0 1 1]);
print(fig,'-dpdf','MATH2860Summer2014Assignment1');
clear('F','a','b','e','f','c','d','h','hh','i','j','colrs','markersizes','symbls','nsteps','x','x0','y','y0','xx','yy','xlast','fig','bb','ff');
dy_ycos2 x sin x-0, y(?/2) 1 1. Solve the IVP above. (You must do this by hand and submit one neat 2. Use Euler's method to approximate the solution for r values between copy per group.) 0 and 3 using the matlab file provided (make the appropriate changes in that file) with step sizes h 0.1, h = 0.05, h = 0.01. NOTE: running the matlab file will produce a pdf file that each member of the group should print and attach to the as- signme nt submissionStep by Step Solution
There are 3 Steps involved in it
Step: 1

Get Instant Access to Expert-Tailored Solutions
See step-by-step solutions with expert insights and AI powered tools for academic success
Step: 2

Step: 3
Ace Your Homework with AI
Get the answers you need in no time with our AI-driven, step-by-step assistance
Get Started
Graph Databases
Authors: Ian Robinson, Jim Webber, Emil Eifrem
1st Edition
1449356265, 978-1449356262