Answered step by step
Verified Expert Solution
Question
1 Approved Answer
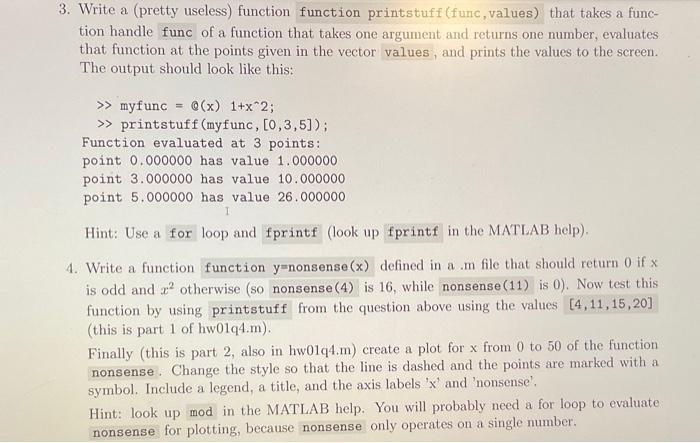
Solve part one of number 4 know that printstuff is the coding below 3. Write a (pretty useless) function function printstuff (func, values) that takes
Solve part one of number 4 know that "printstuff" is the coding below 

3. Write a (pretty useless) function function printstuff (func, values) that takes a function handle func of a function that takes one argument and returns one number, evaluates that function at the points given in the vector values, and prints the values to the screen. The output should look like this: myfunc =Q(x)1+x2; printstuff (myfunc, [0,3,5] ); Function evaluated at 3 points: point 0.000000 has value 1.000000 point 3.000000 has value 10.000000 point 5.000000 has value 26.000000 Hint: Use a for loop and fprintf (look up in the MATLAB help). is odd and x2 otherwise (so nonsense (4) is 16 , while nonsense(11) is 0 ). Now test this function by using printstuff from the question above using the values (this is part 1 of hw01q4.m). Finally (this is part 2, also in hw01q4.m) create a plot for x from 0 to 50 of the function nonsense. Change the style so that the line is dashed and the points are marked with a symbol. Include a legend, a title, and the axis labels ' x ' and 'nonsense'. Hint: look up mod in the MATLAB help. You will probably need a for loop to evaluate nonsense for plotting, because nonsense only operates on a single number. function printstuff(func, values) fprintf('Function evaluated at \% . of points: ', length(values)) for ii=1:length(values) fprintf('point \% 0.6f has value \%0.6f , values(ii), func(values(ii))) end 

Step by Step Solution
There are 3 Steps involved in it
Step: 1

Get Instant Access to Expert-Tailored Solutions
See step-by-step solutions with expert insights and AI powered tools for academic success
Step: 2

Step: 3

Ace Your Homework with AI
Get the answers you need in no time with our AI-driven, step-by-step assistance
Get Started


