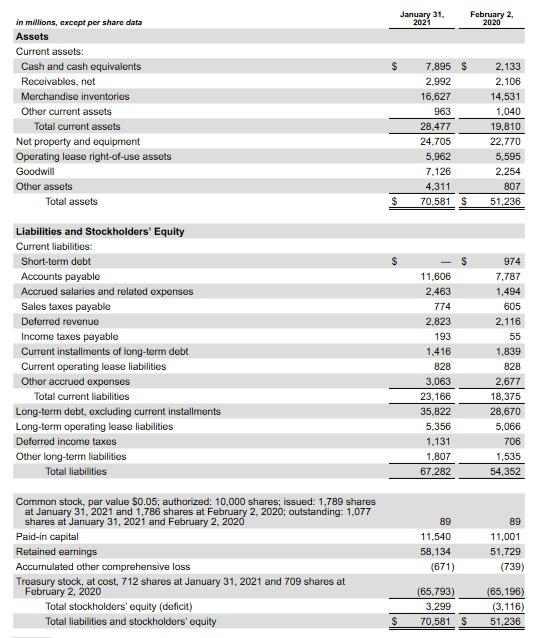
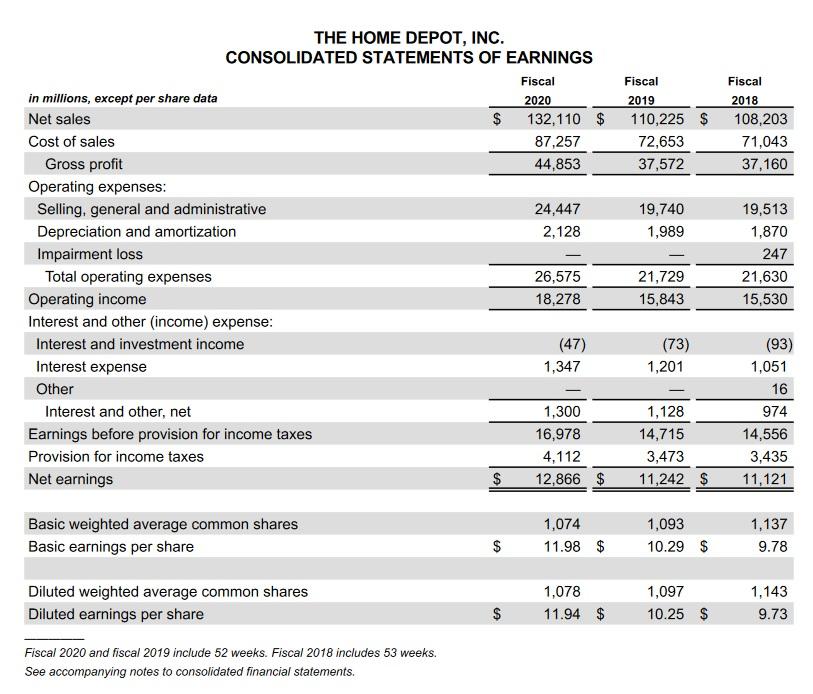
Solve Pre-Tax return on equity and Pre-tax return on assets please... not sure how to get shareholders equity. Please explain.

10k sheets


Pre-Tax Return on Equity (Pre-Tax Profit* / Shareholders' Equity Pre-Tax Return on Assets (Pre-Tax Profit**/Total Assets) January 31, 2021 February 2, 2020 $ in millions, except per share data Assets Current assets: Cash and cash equivalents Receivables, net Merchandise inventories Other current assets Total current assets Net property and equipment Operating lease right-of-use assets Goodwill Other assets Total assets 7.895 $ 2.992 16,627 963 28.477 24.705 5,962 7.126 4.311 70,581 $ 2,133 2,106 14,531 1,040 19,810 22,770 5,595 2.254 807 51,236 $ Liabilities and Stockholders' Equity Current liabilities: Short-term debt Accounts payable Accrued salaries and related expenses Sales taxes payable Deferred revenue Income taxes payable Current installments of long-term debt Current operating lease liabilities Other accrued expenses Total current liabilities Long-term debt, excluding current installments Long-term operating loaso liabilities Deferred income taxes Other long-term liabilities Total liabilities 11.606 2.463 774 2.823 193 1.416 828 3,063 23.166 35,822 5.356 1.131 1,807 67.282 974 7,787 1,494 605 2.116 55 1,839 828 2,677 18,375 28,670 5,066 706 1,535 54,352 Common stock, par value $0.05, authorized: 10,000 shares; issued: 1,789 shares at January 31, 2021 and 1,786 shares at February 2, 2020; outstanding: 1.077 shares at January 31, 2021 and February 2, 2020 Paid-in capital Retained earnings Accumulated other comprehensive loss Treasury stock, at cost, 712 shares at January 31, 2021 and 709 shares at February 2, 2020 Total stockholders' equity (deficit) Total liabilities and stockholders' equity 89 11,540 58.134 (671) 89 11,001 51,729 (739) (65.793) 3.299 70,581 $ (65,196) (3,116) 51,236 $ THE HOME DEPOT, INC. CONSOLIDATED STATEMENTS OF EARNINGS Fiscal $ 2020 132,110 $ 87,257 44,853 Fiscal 2019 110,225 $ 72,653 37,572 Fiscal 2018 108,203 71,043 37,160 24,447 2,128 19,740 1,989 in millions, except per share data Net sales Cost of sales Gross profit Operating expenses: Selling, general and administrative Depreciation and amortization Impairment loss Total operating expenses Operating income Interest and other (income) expense: Interest and investment income Interest expense Other Interest and other, net Earnings before provision for income taxes Provision for income taxes Net earnings 19,513 1,870 247 21,630 15,530 26,575 18,278 21,729 15,843 (47) 1,347 (73) 1,201 1,300 16,978 4,112 12,866 $ 1,128 14,715 3,473 11,242 $ (93) 1,051 16 974 14,556 3,435 11,121 $ Basic weighted average common shares Basic earnings per share 1,074 11.98 $ 1,093 10.29 $ 1,137 9.78 $ Diluted weighted average common shares Diluted earnings per share 1,078 11.94 $ 1,097 10.25 $ 1,143 9.73 $ Fiscal 2020 and fiscal 2019 include 52 weeks. Fiscal 2018 includes 53 weeks. See accompanying notes to consolidated financial statements


