

Answered step by step
Verified Expert Solution
Question
1 Approved Answer
Solve questions 4-7 only, please. Here are the assumptions: Sales price per unit =$14.31 per unit Total Fixed costs =1,052,800 Variable cost per unit =$8.33
Solve questions 4-7 only, please.
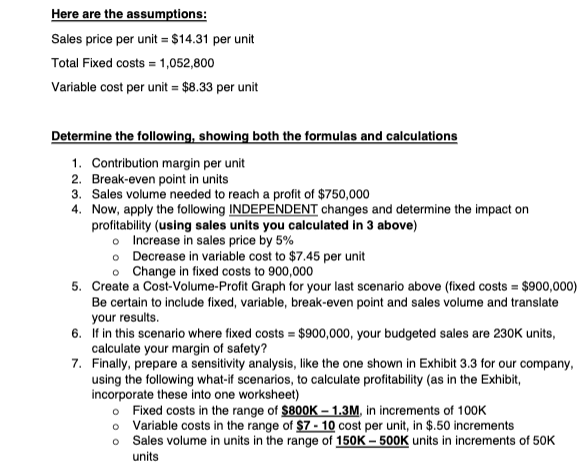
Here are the assumptions: Sales price per unit =$14.31 per unit Total Fixed costs =1,052,800 Variable cost per unit =$8.33 per unit Determine the following, showing both the formulas and calculations 1. Contribution margin per unit 2. Break-even point in units 3. Sales volume needed to reach a profit of $750,000 4. Now, apply the following INDEPENDENT changes and determine the impact on profitability (using sales units you calculated in 3 above) - Increase in sales price by 5% - Decrease in variable cost to $7.45 per unit - Change in fixed costs to 900,000 5. Create a Cost-Volume-Profit Graph for your last scenario above (fixed costs =$900,000 Be certain to include fixed, variable, break-even point and sales volume and translate your results. 6. If in this scenario where fixed costs =$900,000, your budgeted sales are 230K units, calculate your margin of safety? 7. Finally, prepare a sensitivity analysis, like the one shown in Exhibit 3.3 for our company, using the following what-if scenarios, to calculate profitability (as in the Exhibit, incorporate these into one worksheet) - Fixed costs in the range of $800K1.3M, in increments of 100K - Variable costs in the range of $710 cost per unit, in $.50 increments - Sales volume in units in the range of 150K500K units in increments of 50K units Here are the assumptions: Sales price per unit =$14.31 per unit Total Fixed costs =1,052,800 Variable cost per unit =$8.33 per unit Determine the following, showing both the formulas and calculations 1. Contribution margin per unit 2. Break-even point in units 3. Sales volume needed to reach a profit of $750,000 4. Now, apply the following INDEPENDENT changes and determine the impact on profitability (using sales units you calculated in 3 above) - Increase in sales price by 5% - Decrease in variable cost to $7.45 per unit - Change in fixed costs to 900,000 5. Create a Cost-Volume-Profit Graph for your last scenario above (fixed costs =$900,000 Be certain to include fixed, variable, break-even point and sales volume and translate your results. 6. If in this scenario where fixed costs =$900,000, your budgeted sales are 230K units, calculate your margin of safety? 7. Finally, prepare a sensitivity analysis, like the one shown in Exhibit 3.3 for our company, using the following what-if scenarios, to calculate profitability (as in the Exhibit, incorporate these into one worksheet) - Fixed costs in the range of $800K1.3M, in increments of 100K - Variable costs in the range of $710 cost per unit, in $.50 increments - Sales volume in units in the range of 150K500K units in increments of 50K unitsStep by Step Solution
There are 3 Steps involved in it
Step: 1

Get Instant Access to Expert-Tailored Solutions
See step-by-step solutions with expert insights and AI powered tools for academic success
Step: 2

Step: 3
Ace Your Homework with AI
Get the answers you need in no time with our AI-driven, step-by-step assistance
Get Started
Auditing Business Continuity Plans Assess And Improve Your Performance Against ISO 22301
Authors: John Silltow
2nd Edition
058074342X, 978-0580743429