solve the following question
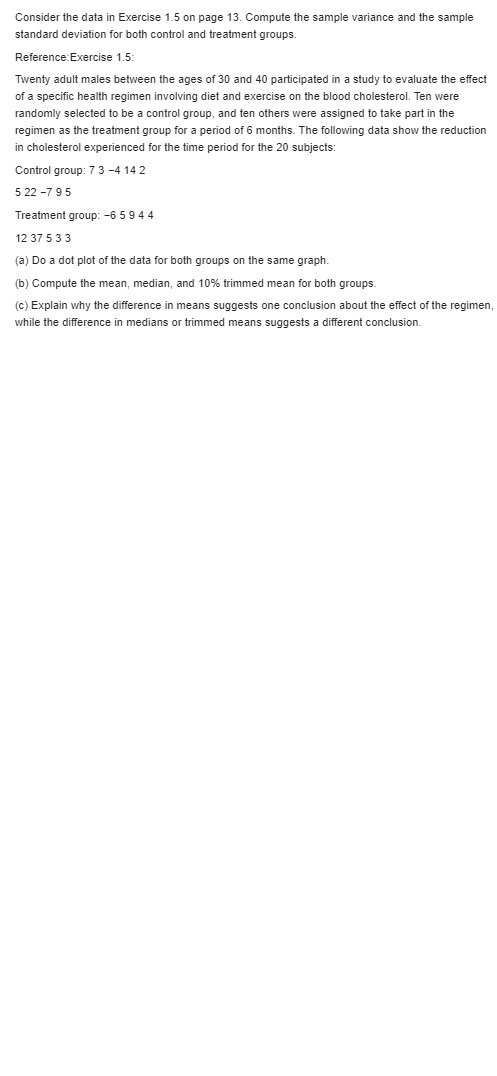
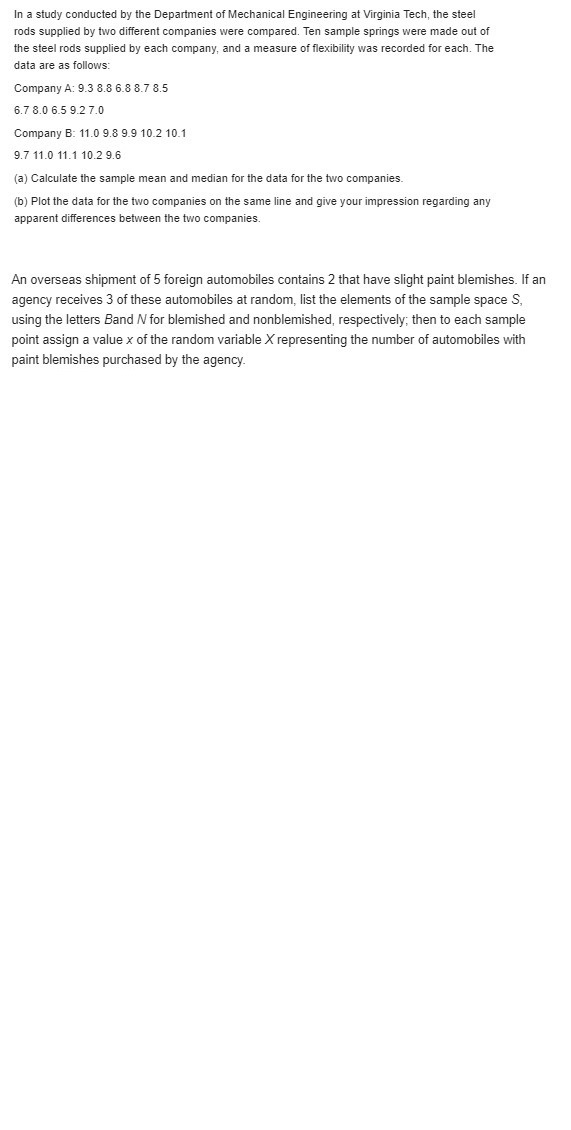
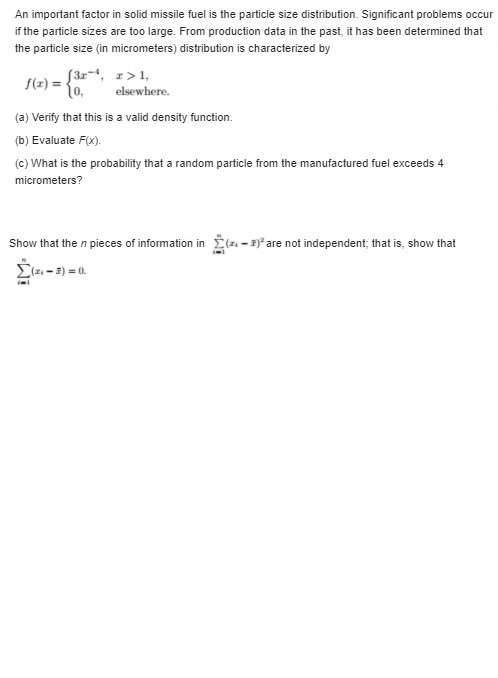
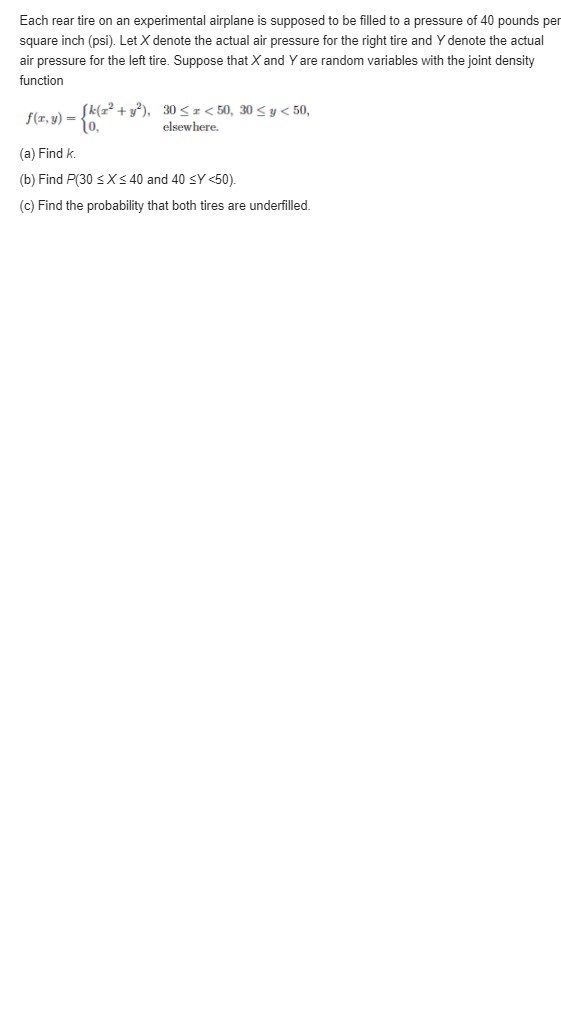
Consider the data in Exercise 1.5 on page 13. Compute the sample variance and the sample standard deviation for both control and treatment groups. Reference Exercise 1.5: Twenty adult males between the ages of 30 and 40 participated in a study to evaluate the effect of a specific health regimen involving diet and exercise on the blood cholesterol. Ten were randomly selected to be a control group, and ten others were assigned to take part in the regimen as the treatment group for a period of 6 months. The following data show the reduction in cholesterol experienced for the time period for the 20 subjects: Control group: 7 3 -4 14 2 522 -7 95 Treatment group: -6 5 9 4 4 12 37 5 3 3 (a) Do a dot plot of the data for both groups on the same graph. (b) Compute the mean, median, and 10% trimmed mean for both groups. (c) Explain why the difference in means suggests one conclusion about the effect of the regimen, while the difference in medians or trimmed means suggests a different conclusion.In a study conducted by the Department of Mechanical Engineering at Virginia Tech, the steel rods supplied by two different companies were compared. Ten sample springs were made out of the steel rods supplied by each company, and a measure of flexibility was recorded for each. The data are as follows: Company A: 9.3 8.8 6.8 8.7 8.5 6.7 8.0 6.5 9.2 7.0 Company B: 11.0 9.8 9.9 10.2 10.1 9.7 11.0 11.1 10.2 9.6 (a) Calculate the sample mean and median for the data for the two companies. (b) Plot the data for the two companies on the same line and give your impression regarding any apparent differences between the two companies. An overseas shipment of 5 foreign automobiles contains 2 that have slight paint blemishes. If an agency receives 3 of these automobiles at random, list the elements of the sample space S, using the letters Band / for blemished and nonblemished, respectively; then to each sample point assign a value x of the random variable X representing the number of automobiles with paint blemishes purchased by the agency.An important factor in solid missile fuel is the particle size distribution. Significant problems occur if the particle sizes are too large. From production data in the past, it has been determined that the particle size (in micrometers) distribution is characterized by f(x) = [3r, r>1, elsewhere. (a) Verify that this is a valid density function. (b) Evaluate F(x). (c) What is the probability that a random particle from the manufactured fuel exceeds 4 micrometers? Show that the n pieces of information in _ (x - ?) are not independent; that is, show that 2(n- 1) =0Each rear tire on an experimental airplane is supposed to be filled to a pressure of 40 pounds per square inch (psi). Let X denote the actual air pressure for the right tire and Y denote the actual air pressure for the left tire. Suppose that X and Y are random variables with the joint density function f(x, y) = k(x + y'), 30 5 x