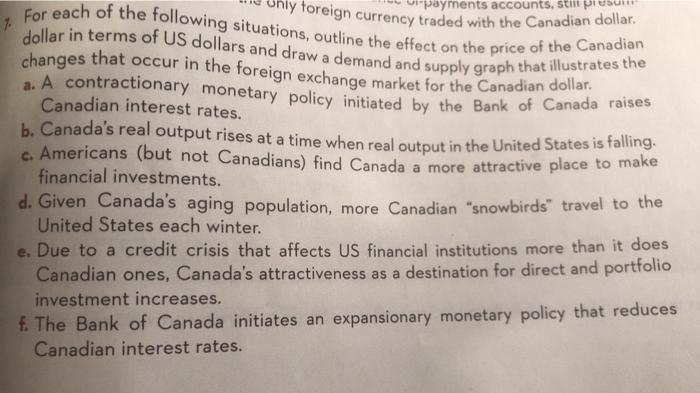

Solve the following.
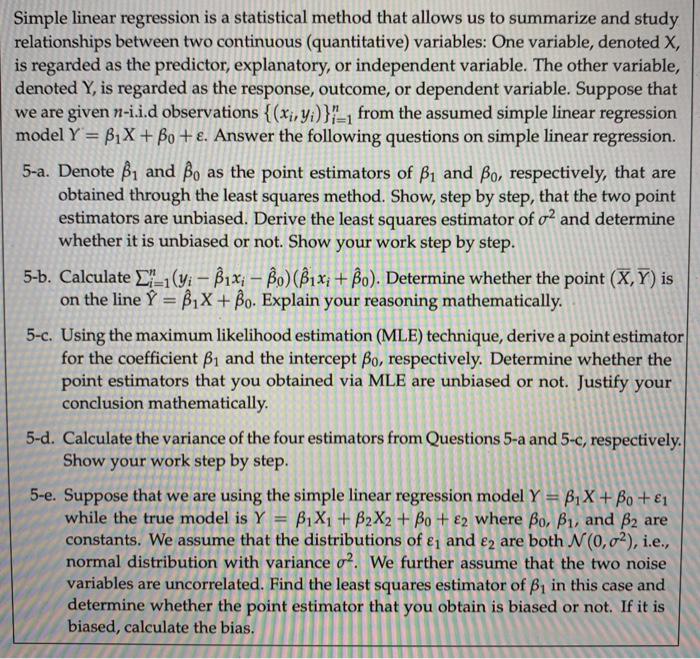
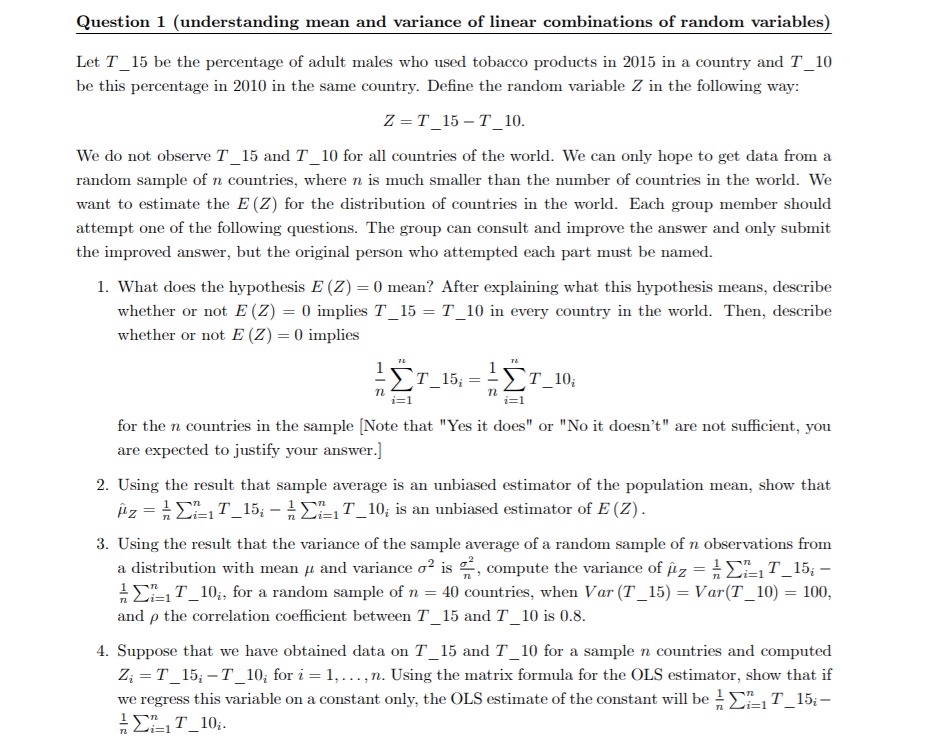
Simple linear regression is a statistical method that allows us to summarize and study relationships between two continuous (quantitative) variables: One variable, denoted X, is regarded as the predictor, explanatory, or independent variable. The other variable, denoted Y, is regarded as the response, outcome, or dependent variable. Suppose that we are given n-i.i.d observations { (x;, y;)}"_, from the assumed simple linear regression model Y = BIX + Bo + . Answer the following questions on simple linear regression. 5-a. Denote 1 and Bo as the point estimators of B, and Bo, respectively, that are obtained through the least squares method. Show, step by step, that the two point estimators are unbiased. Derive the least squares estimator of of and determine whether it is unbiased or not. Show your work step by step. 5-b. Calculate _'_1(yi - Bix; - Bo) (Bix, + Bo). Determine whether the point (X, Y) is on the line Y = 1X + Bo. Explain your reasoning mathematically. 5-c. Using the maximum likelihood estimation (MLE) technique, derive a point estimator for the coefficient B1 and the intercept Bo, respectively. Determine whether the point estimators that you obtained via MLE are unbiased or not. Justify your conclusion mathematically. 5-d. Calculate the variance of the four estimators from Questions 5-a and 5-c, respectively. Show your work step by step. 5-e. Suppose that we are using the simple linear regression model Y = B1 X + Bo + 1 while the true model is Y = 1X1 + B2X2 + Bo + 82 where Bo, B1, and B2 are constants. We assume that the distributions of &, and e2 are both N(0,02), i.e., normal distribution with variance o?. We further assume that the two noise variables are uncorrelated. Find the least squares estimator of B, in this case and determine whether the point estimator that you obtain is biased or not. If it is biased, calculate the bias.Question 1 (understanding mean and variance of linear combinations of random variables) Let T_15 be the percentage of adult males who used tobacco products in 2015 in a country and T_10 be this percentage in 2010 in the same country. Define the random variable Z in the following way: Z =T_15 -T_10. We do not observe T_15 and T_10 for all countries of the world. We can only hope to get data from a random sample of n countries, where n is much smaller than the number of countries in the world. We want to estimate the E (Z) for the distribution of countries in the world. Each group member should attempt one of the following questions. The group can consult and improve the answer and only submit the improved answer, but the original person who attempted each part must be named. 1. What does the hypothesis E (Z) = 0 mean? After explaining what this hypothesis means, describe whether or not E (Z) = 0 implies T_15 = T_10 in every country in the world. Then, describe whether or not E (Z) = 0 implies -Er_15; = -Er_10; 1= 1 1= 1 for the n countries in the sample [Note that "Yes it does" or "No it doesn't" are not sufficient, you are expected to justify your answer.] 2. Using the result that sample average is an unbiased estimator of the population mean, show that iz = MET_15; - MELT_10; is an unbiased estimator of E (Z) . 3. Using the result that the variance of the sample average of a random sample of n observations from a distribution with mean / and variance o' is , compute the variance of /z = > >_,T_15; - " Ein T_10;, for a random sample of n = 40 countries, when Var (T_15) = Var(T_10) = 100, and p the correlation coefficient between 7_15 and T_10 is 0.8. 4. Suppose that we have obtained data on T_15 and T_10 for a sample n countries and computed Z; =T_15; -T_10; for i = 1, ..., n. Using the matrix formula for the OLS estimator, show that if we regress this variable on a constant only, the OLS estimate of the constant will be ! )_, T_15;- = ELIT_10.Question 1 (understanding mean and variance of linear combinations of random variables) Let T_15 be the percentage of adult males who used tobacco products in 2015 in a country and T_10 be this percentage in 2010 in the same country. Define the random variable Z in the following way: Z =T_15 -T_10. We do not observe T_15 and T_10 for all countries of the world. We can only hope to get data from a random sample of n countries, where n is much smaller than the number of countries in the world. We want to estimate the E (Z) for the distribution of countries in the world. Each group member should attempt one of the following questions. The group can consult and improve the answer and only submit the improved answer, but the original person who attempted each part must be named. 1. What does the hypothesis E (Z) = 0 mean? After explaining what this hypothesis means, describe whether or not E (Z) = 0 implies T_15 = T_10 in every country in the world. Then, describe whether or not E (Z) = 0 implies -Er_15; = -Er_10; 1= 1 1= 1 for the n countries in the sample [Note that "Yes it does" or "No it doesn't" are not sufficient, you are expected to justify your answer.] 2. Using the result that sample average is an unbiased estimator of the population mean, show that iz = MET_15; - MELT_10; is an unbiased estimator of E (Z) . 3. Using the result that the variance of the sample average of a random sample of n observations from a distribution with mean / and variance o' is , compute the variance of /z = > >_,T_15; - " Ein T_10;, for a random sample of n = 40 countries, when Var (T_15) = Var(T_10) = 100, and p the correlation coefficient between 7_15 and T_10 is 0.8. 4. Suppose that we have obtained data on T_15 and T_10 for a sample n countries and computed Z; =T_15; -T_10; for i = 1, ..., n. Using the matrix formula for the OLS estimator, show that if we regress this variable on a constant only, the OLS estimate of the constant will be ! )_, T_15;- = ELIT_10.A restaurant faces very high demand for its signature mousse desserts in the evening but is less busy during the day. Its manager estimates that inverse demand functions are pe = 30 - Qe in the evening and pd = 16 -Qd during the day, where e and d denote evening and daytime. The marginal cost of producing its dessert evening, MCe, is $8. The marginal cost of producing its dessert daytime, MCd, is $4. There is no fixed cost of producing dessert. Create a spreadsheet with the column headings Qe, Pe, TRe, MRe, TCe, MCe, ne, Qd, Pd, TRd, MRd, TCd, MCd, and nd. (note: ne is profit evening and nd indicates profit daytime) a. What are the optimal prices for the dessert that the restaurant should charge during the evening hours? b. What is the optimal quantity for the dessert that the restaurant should produce during the evening hours? c. What is the total cost of producing the optimal quantity for the dessert during the evening hours? d. What is the maximum profit for the dessert that the restaurant should produce during the evening hours? e. What are the optimal prices for the dessert that the restaurant should charge during the daytime hours? f. What is the optimal quantity for the dessert that the restaurant should produce during the daytime hours? I g. What is the total cost of producing the optimal quantity for the dessert during the daytime hours? h. What is the maximum profit for the dessert that the restaurant should produce during the daytime hours?vi payments accounts, still PLEsuit IsOnly foreign currency traded with the Canadian dollar. 7. For each of the following situations, outline the effect on the price of the Canadian dollar in terms of US dollars and draw a demand and supply graph that illustrates the changes that occur in the foreign exchange market for the Canadian dollar. . A contractionary monetary policy initiated by the Bank of Canada raises Canadian interest rates. b. Canada's real output rises at a time when real output in the United States is falling. c. Americans (but not Canadians) find Canada a more attractive place to make financial investments. d. Given Canada's aging population, more Canadian "snowbirds" travel to the United States each winter. e. Due to a credit crisis that affects US financial institutions more than it does Canadian ones, Canada's attractiveness as a destination for direct and portfolio investment increases. f. The Bank of Canada initiates an expansionary monetary policy that reduces Canadian interest rates