Solve the math:
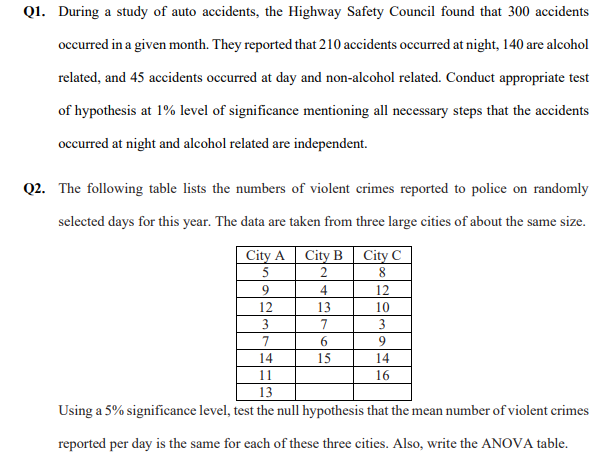
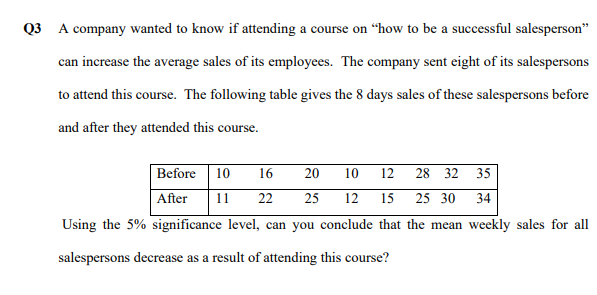
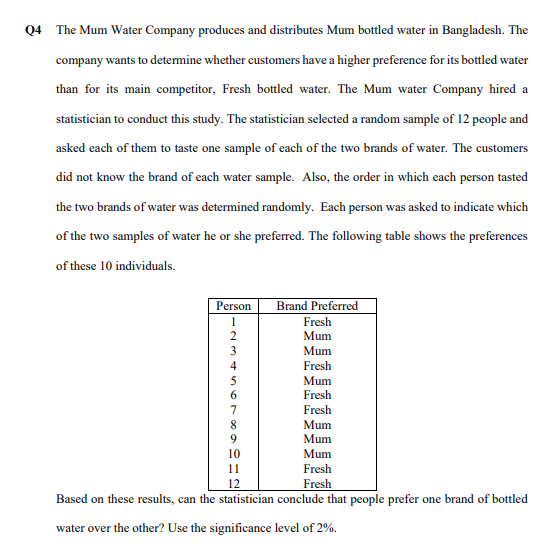
01. oz. Dining a study of auto accidents, the Highway Safety Council found that Bill] accidents occurred in a given month. They reported that 21D accidents occurred at night, 14!] are alcohol related, and 45 accidents occurred at day and non-alcohol related. Conduct appropriate test of hypothesis at 1% level of signicance mentioning all necsary steps that the accidents occurred at night and alcohol related are independent. The following table lists the numbers of violent crimes reported to police on randomly selected days for this year. The data are taken from three large cities of about the same size. Using a 5% signicance level, test the null hypothesis that the mean number of violent crimes reported per day is the same for each of these three cities. Also, write the ANOVA table. Q3 A company wanted to know if attending a course on "how to be a successful salesperson" can increase the average sales of its employees. The company sent eight of its salespersons to attend this course. The following table gives the 8 days sales of these salespersons before and after they attended this course. Before 10 16 20 10 12 28 32 35 After 11 22 25 12 15 25 30 34 Using the 5% significance level, can you conclude that the mean weekly sales for all salespersons decrease as a result of attending this course?Q4 The Mum Water Company produces and distributes Mum bottled water in Bangladesh. The company wants to determine whether customers have a higher preference for its bottled water than for its main competitor, Fresh bottled water. The Mum water Company hired a statistician to conduct this study. The statistician selected a random sample of 12 people and asked each of them to taste one sample of each of the two brands of water. The customers did not know the brand of each water sample. Also, the order in which each person tasted the two brands of water was determined randomly. Each person was asked to indicate which of the two samples of water he or she preferred. The following table shows the preferences of these 10 individuals. Person Brand Preferred Fresh Mum Mum WAWN Fresh Mum Fresh Fresh Mum Mum 10 Mum 11 Fresh 12 Fresh Based on these results, can the statistician conclude that people prefer one brand of bottled water over the other? Use the significance level of 2%