Question: Solve the question Consider the data in Exercise 1.5 on page 13. Compute the sample variance and the sample standard deviation for both control and
Solve the question
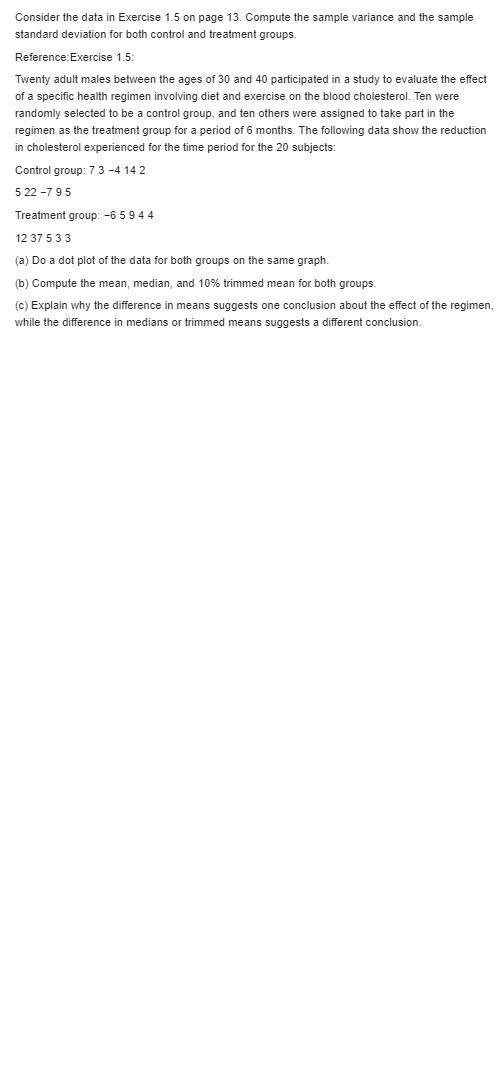
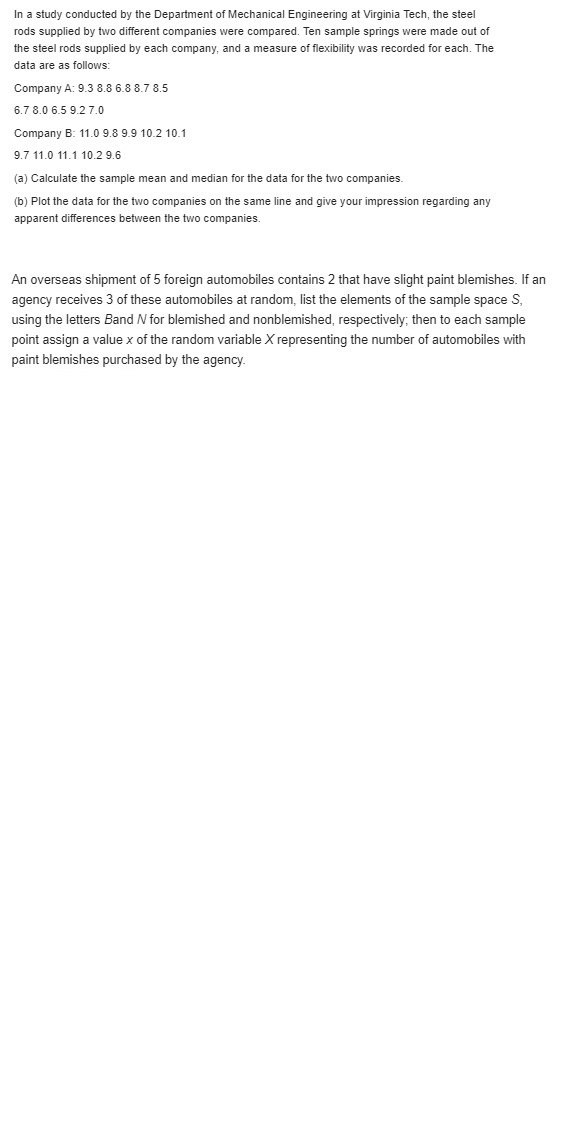
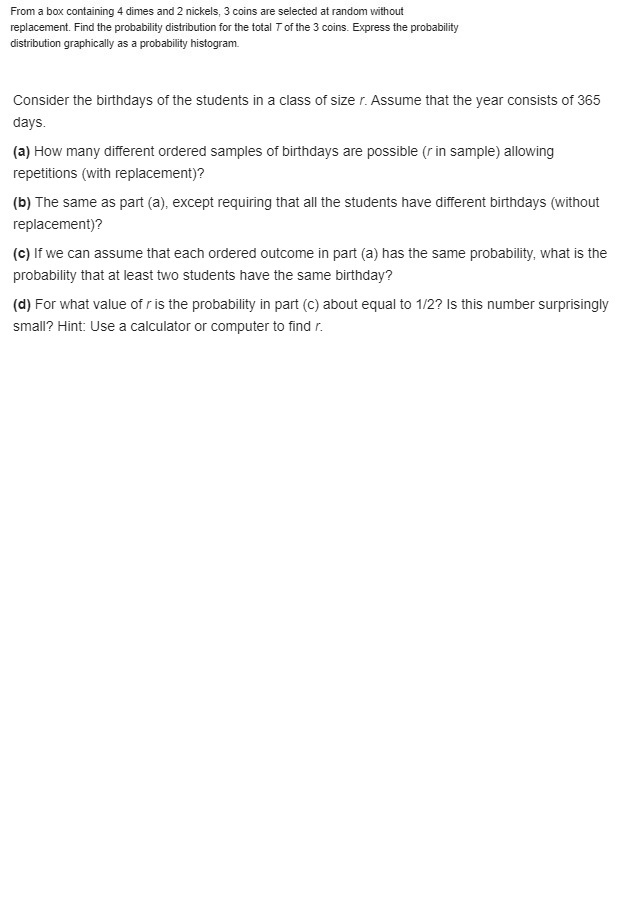
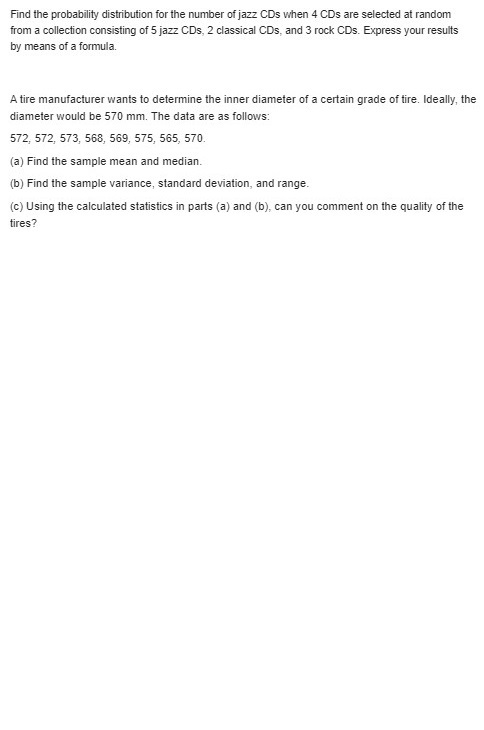
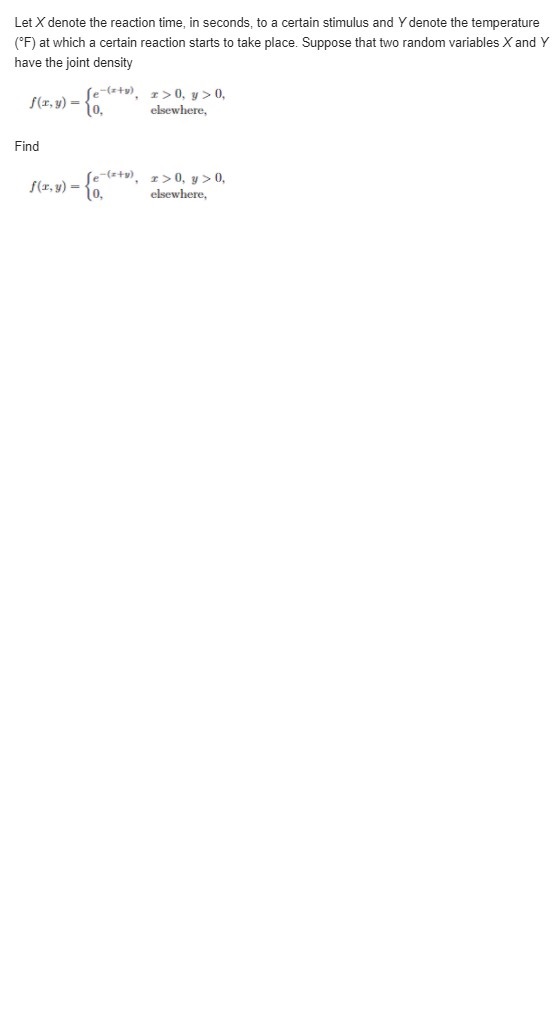
Consider the data in Exercise 1.5 on page 13. Compute the sample variance and the sample standard deviation for both control and treatment groups. Reference Exercise 1.5: Twenty adult males between the ages of 30 and 40 participated in a study to evaluate the effect of a specific health regimen involving diet and exercise on the blood cholesterol. Ten were randomly selected to be a control group, and ten others were assigned to take part in the regimen as the treatment group for a period of 6 months. The following data show the reduction in cholesterol experienced for the time period for the 20 subjects: Control group: 7 3 -4 14 2 522 -7 95 Treatment group: -6 5 9 4 4 12 37 5 3 3 (a) Do a dot plot of the data for both groups on the same graph. (b) Compute the mean, median, and 10% trimmed mean for both groups. (c) Explain why the difference in means suggests one conclusion about the effect of the regimen, while the difference in medians or trimmed means suggests a different conclusion.In a study conducted by the Department of Mechanical Engineering at Virginia Tech, the steel rods supplied by two different companies were compared. Ten sample springs were made out of the steel rods supplied by each company, and a measure of flexibility was recorded for each. The data are as follows: Company A: 9.3 8.8 6.8 8.7 8.5 6.7 8.0 6.5 9.2 7.0 Company B: 11.0 9.8 9.9 10.2 10.1 9.7 11.0 11.1 10.2 9.6 (a) Calculate the sample mean and median for the data for the two companies. (b) Plot the data for the two companies on the same line and give your impression regarding any apparent differences between the two companies. An overseas shipment of 5 foreign automobiles contains 2 that have slight paint blemishes. If an agency receives 3 of these automobiles at random, list the elements of the sample space S, using the letters Band / for blemished and nonblemished, respectively; then to each sample point assign a value x of the random variable X representing the number of automobiles with paint blemishes purchased by the agency.From a box containing 4 dimes and 2 nickels, 3 coins are selected at random without replacement. Find the probability distribution for the total 7 of the 3 coins. Express the probability distribution graphically as a probability histogram. Consider the birthdays of the students in a class of size r. Assume that the year consists of 365 days. (a) How many different ordered samples of birthdays are possible (r in sample) allowing repetitions (with replacement)? (b) The same as part (a), except requiring that all the students have different birthdays (without replacement)? (c) If we can assume that each ordered outcome in part (a) has the same probability, what is the probability that at least two students have the same birthday? (d) For what value of r is the probability in part (c) about equal to 1/2? Is this number surprisingly small? Hint: Use a calculator or computer to find r.Find the probability distribution for the number of jazz CDs when 4 CDs are selected at random from a collection consisting of 5 jazz CDs, 2 classical CDs, and 3 rock CDs. Express your results by means of a formula. A tire manufacturer wants to determine the inner diameter of a certain grade of tire. Ideally, the diameter would be 570 mm. The data are as follows: 572, 572, 573, 568, 569, 575, 565, 570. (a) Find the sample mean and median. (b) Find the sample variance, standard deviation, and range. (c) Using the calculated statistics in parts (a) and (b), can you comment on the quality of the tires?Let X denote the reaction time, in seconds, to a certain stimulus and Y denote the temperature ('F) at which a certain reaction starts to take place. Suppose that two random variables X and Y have the joint density f(x, y) = 10. -(sty), r>0, y>0, elsewhere, Find -(sty). r>0, y>0, f(x,y) = 10, elsewhere
Step by Step Solution
There are 3 Steps involved in it

Get step-by-step solutions from verified subject matter experts


