solve the question
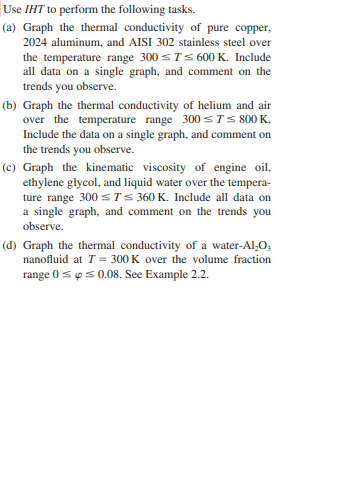
Exercise 1.3 on page 13 showed tensile strength data for two samples, one in which specimens were exposed to an aging process and one in which there was no aging of the specimens. (a) Calculate the sample variance as well as standard deviation in tensile strength for both samples. (b) Does there appear to be any evidence that aging affects the variability in tensile strength? (See also the plot for Exercise 1.3 on page 13.) Reference: Exercise 1.3: A certain polymer is used for evacuation systems for aircraft. It is important that the polymer be resistant to the aging process. Twenty specimens of the polymer were used in an experiment. Ten were assigned randomly to be exposed to an accelerated batch aging process that involved exposure to high temperatures for 10 days. Measurements of tensile strength of the specimens were made, and the following data were recorded on tensile strength in psi: No aging: 227 222 218 217 225 218 216 229 228 221 Aging: 219 214 215 211 209 218 203 204 201 205 (a) Do a dot plot of the data. (b) From your plot, does it appear as if the aging process has had an effect on the tensile strength of thispolymer? Explain. (c) Calculate the sample mean tensile strength of the two samples. (d) Calculate the median for both. Discuss the similarity or lack of similarity between the mean andmedian of each group.Compute the sample variance and standard deviation for the water absorbency data of Exercise 1.2 on page 13. Reference: Exercise 1.2 According to the journal Chemical Engineering, an important property of a fiber is its water absorbency. A random sample of 20 pieces of cotton fiber was taken and the absorbency on each piece was measured. The following are the absorbency values: 18.71 21.41 20.72 21.81 19.29 22.43 20.17 23.71 19.44 20.50 18.92 20.33 23.00 22.85 19.25 21.77 22.11 19.77 18.04 21.12 (a) Calculate the sample mean and median for the above sample values. (b) Compute the 10% trimmed mean. (c) Do a dot plot of the absorbency data. (d) Using only the values of the mean, median, and trimmed mean, do you have evidence of outliers in the data?According to the journal Chemical Engineering, an important property of a fiber is its water absorbency. A random sample of 20 pieces of cotton fiber was taken and the absorbency on each piece was measured. The following are the absorbency values: 18.71 21.41 20.72 21.81 19.29 22.43 20.17 23.71 19.44 20.50 18.92 20.33 23.00 22.85 19.25 21.77 22.11 19.77 18.04 21.12 (a) Calculate the sample mean and median for the above sample values. (b) Compute the 10% trimmed mean. (c) Do a dot plot of the absorbency data. (d) Using only the values of the mean, median, and trimmed mean, do you have evidence of outliers in the data? Let Wbe a random variable giving the number of heads minus the number of tails in three tosses of a coin. List the elements of the sample space S for the three tosses of the coin and to each sample point assign a value w of W.Use IHT to perform the following tasks. (a) Graph the thermal conductivity of pure copper, 2024 aluminum, and AISI 302 stainless steel over the temperature range 300 $ 7's 600 K. Include all data on a single graph, and comment on the trends you observe. (b) Graph the thermal conductivity of helium and air over the temperature range 300 s 7s 800 K. Include the data on a single graph, and comment on the trends you observe. (c) Graph the kinematic viscosity of engine oil. ethylene glycol, and liquid water over the tempera- ture range 300 # 7 = 360 K. Include all data on a single graph, and comment on the trends you observe. (d) Graph the thermal conductivity of a water-Al,O, nanofluid at 7 = 300 K over the volume fraction range 0 5 + 3 0.08. See Example 2.2.A pan is used to boil water by placing it on a stove, from which heat is transferred at a fixed rate q. There are two stages to the process. In Stage 1, the water is taken from its initial (room) temperature 7, to the boiling point, as heat is transferred from the pan by natural convection. During this stage, a constant value of the convection coef- ficient h may be assumed, while the bulk temperature of the water increases with time, Iz = 7_(n). In Stage 2, the water has come to a boil, and its temperature remains at a fixed value, Tz = 7, as heating continues. Consider a pan bottom of thickness L and diameter D, with a coordi- nate system corresponding to x = 0 and x = L for the sur- faces in contact with the stove and water, respectively. (a) Write the form of the heat equation and the boundary/ initial conditions that determine the variation of temperature with position and time, 7(x, /), in the pan bottom during Stage 1. Express your result in terms of the parameters q., D. L. h, and Tz, as well as appropriate properties of the pan material. b) During Stage 2. the surface of the pan in contact with the water is at a fixed temperature, 7(L, () = Tz > T. Write the form of the heat equation and boundary conditions that determine the temperature distribution 7(x) in the pan bottom. Express your result in terms of the parameters q., D. L, and Tr, as well as appropriate properties of the pan material.Temperature distributions within a series of one- dimensional plane walls at an initial time, at steady state, and at several intermediate times are as shown. 1-0 L L (a) L L (c) (d) For each case, write the appropriate form of the heat dif- fusion equation. Also write the equations for the initial condition and the boundary conditions that are applied at x = 0 and x = L. If volumetric generation occurs, it is uniform throughout the wall. The properties are constant