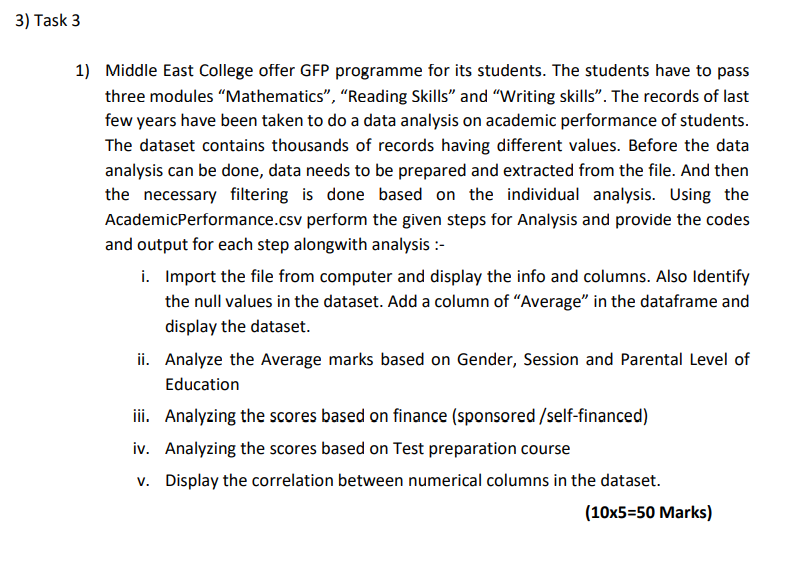
Question: solve the task used Python language with shows explain about each code. -------------------------------------------------------------------------------------------------------- --------------------------------------------------------------------------------------------------------------------- The AcademicPerformance.csv is shows as below (it contains large data for
solve the task used Python language with shows explain about each code.
--------------------------------------------------------------------------------------------------------

---------------------------------------------------------------------------------------------------------------------
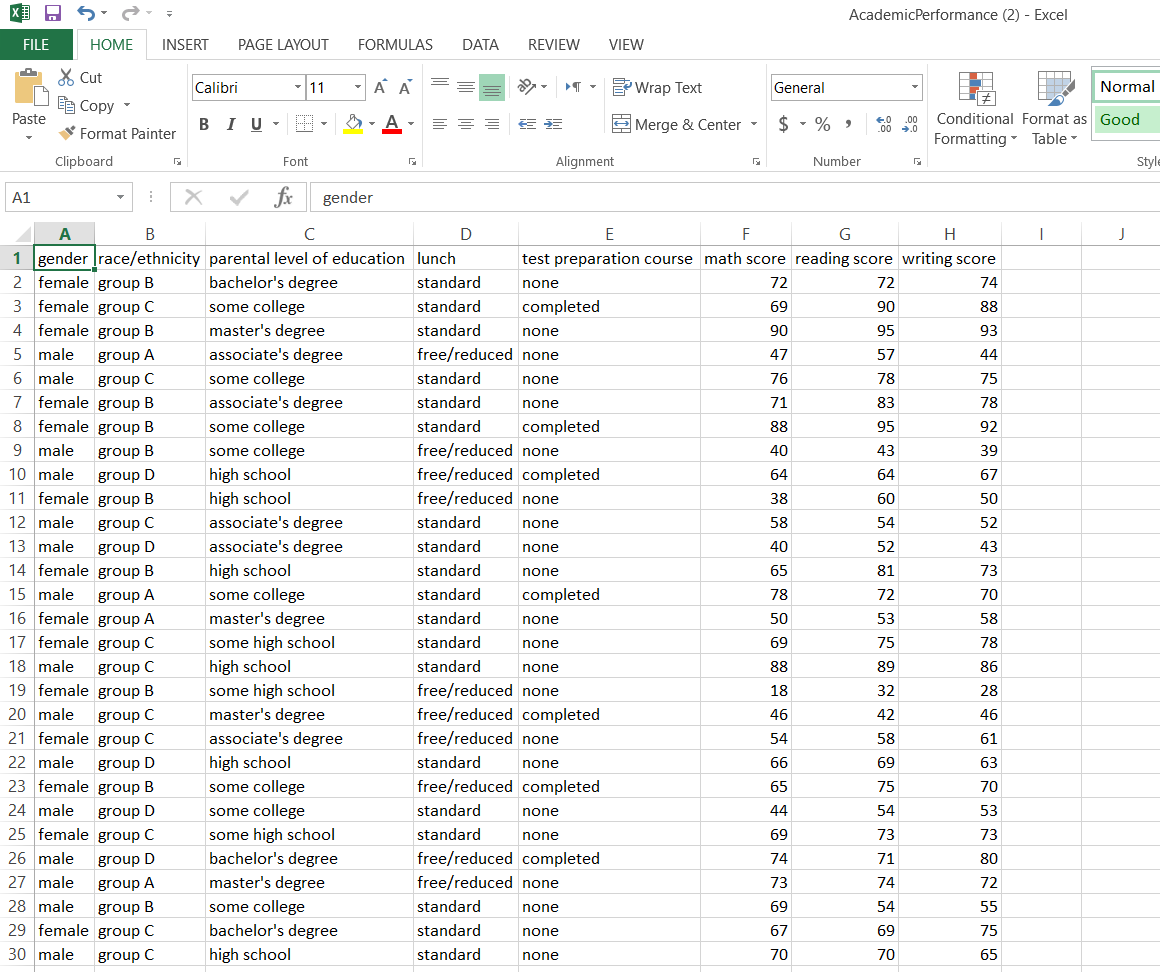
The AcademicPerformance.csv is shows as below (it contains large data for that I attached as image)
---------------------------------------------------------------------------------------------------------------------

3) Task 3 1) Middle East College offer GFP programme for its students. The students have to pass three modules Mathematics, Reading Skills and Writing skills. The records of last few years have been taken to do a data analysis on academic performance of students. The dataset contains thousands of records having different values. Before the data analysis can be done, data needs to be prepared and extracted from the file. And then the necessary filtering is done based on the individual analysis. Using the AcademicPerformance.csv perform the given steps for Analysis and provide the codes and output for each step alongwith analysis :- i. Import the file from computer and display the info and columns. Also Identify the null values in the dataset. Add a column of Average in the dataframe and display the dataset. ii. Analyze the Average marks based on Gender, Session and Parental Level of Education iii. Analyzing the scores based on finance (sponsored /self-financed) iv. Analyzing the scores based on Test preparation course V. Display the correlation between numerical columns in the dataset. (10x5=50 Marks) X Academic Performance (2) - Excel FILE HOME INSERT PAGE LAYOUT FORMULAS DATA REVIEW VIEW Calibri 11 AA - Wrap Text General Normal * Cut Copy Format Painter Paste BIU- A = Merge & Center $ - % 500 Conditional Format as Good Formatting Table Style Clipboard Font Alignment Number A1 X fr gender J group B group C B D E F G H 1 gender Irace/ethnicity parental level of education lunch test preparation course math score reading score writing score 2 female group B bachelor's degree standard none 72 72 74 3 female group C some college standard completed 69 90 88 4 female group B master's degree standard none 90 95 93 5 male associate's degree free/reduced none 47 group A 57 44 6 male some college standard group C none 76 75 78 7 female group B associate's degree standard none 71 83 78 8 female group B some college standard completed 88 95 92 9 male free/reduced none some college 40 43 39 10 male high school free/reduced completed 64 64 group D 67 11 female group B high school free/reduced none 38 60 50 12 male associate's degree standard none 58 54 52 13 male associate's degree standard group D none 40 52 43 14 female group B high school standard none 65 81 73 15 male some college group A standard completed 78 72 70 16 female group A master's degree standard none 50 53 58 17 female group C some high school standard none 69 75 78 18 male standard none 88 high school 89 86 19 female group B some high school free/reduced none 18 32 28 20 male free/reduced completed master's degree 46 42 46 21 female group C associate's degree free/reduced none 54 58 61 22 male standard 66 group D none 69 high school 63 23 female group B free/reduced completed some college 65 75 70 24 male standard 44 group D none 54 some college 53 25 female group C some high school standard none 69 73 73 26 male bachelor's degree free/reduced completed 74 group D 71 80 27 male master's degree group A free/reduced none 73 74 72 28 male some college standard none 69 55 54 29 female group C bachelor's degree standard none 67 69 75 30 male standard high school none 70 70 65 group C group C group B group C
Step by Step Solution
There are 3 Steps involved in it

Get step-by-step solutions from verified subject matter experts


