Answered step by step
Verified Expert Solution
Question
1 Approved Answer
Solve the three ratios for 2019-2020 ACCOUNTS RECEIVABLE TURNOVER Net Credit Sales Average Accounts Receivable 365 365 27 30 DAYS TO COLLECT 39 40 41
Solve the three ratios for 2019-2020 


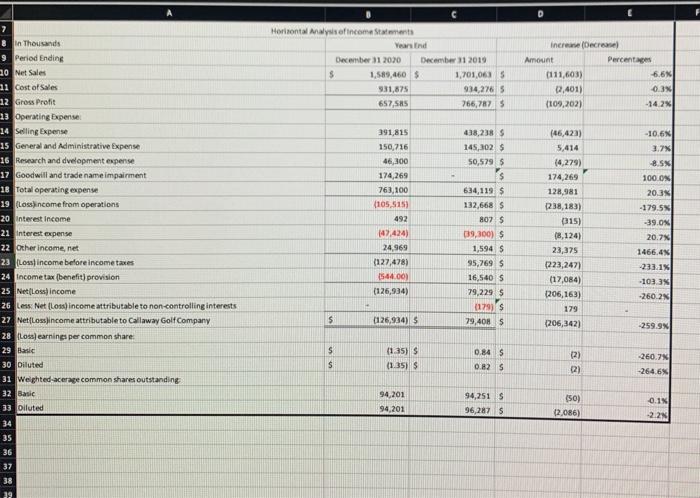
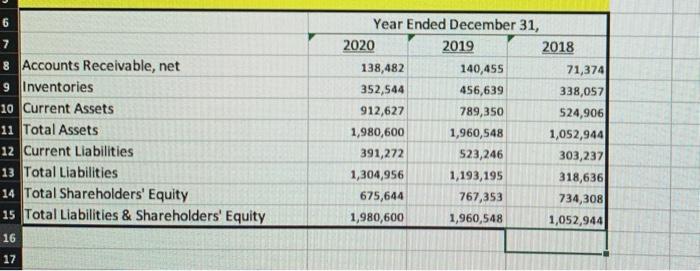
ACCOUNTS RECEIVABLE TURNOVER Net Credit Sales Average Accounts Receivable 365 365 27 30 DAYS TO COLLECT 39 40 41 42 365 Accounts Recievable Turnover Ratio 4 INVENTORY TURNOVER Net Sales Average Inventory at Selling Price C D Horizontal Analysis of income Statements Years in December 31 2020 December 21 2019 $ 1,589,460 1,701,063 S 931,875 934,2765 657,585 766,7875 increase (Decreme Amount Percentages 0111,603) -6.6% 27,401) 0.3% (109,202) -14.2% 7 & in Thousands 9 Period Ending 20 Net Sales 21 Cost of Sales 12 Gross Profit 13 Operating Expense 14 Selling Expense 15 General and Administrative Expense 16 Research and dvelopment expense 17 Goodwill and trade name impairment 18 Total operating expense 19 Loss income from operations 20 Interest income 21 interest expense 22 Other income, net 23 (Loss) income before income taxes 24 Income tax benefit) provision 25 NetLoss) income 26 less Net (Loss) income attributable to non-controlling interests 27 Net (Lossincome attributable to Callaway Golf Company 28 Loss) earnings per common share. 29 Basic 30 Diluted 31 Weighted-acerage common shares outstanding 32 Basic 33 Diluted 391,815 150,716 46,300 174,269 763,100 (105,515) 492 438,238 $ 145,302 $ 50,579 5 $ 634,119 $ 132,668 5 8025 039,300) 1,594 S 95,769 $ 16,540 S 79,229 5 (179) -10.6 3. BSN 100.0% 20.3 -179.5% -39.0% (46,423) 5,414 (4,279) 174,269 128,981 1238,183) ( 315) (8,124) 23,375 (223,2471 (17,084) (206,163) 179 (206,342) (47,424) 24.969 (127,478) 1564.00) (126,934) 20.7% 1466.4% -233.1% -1033% 260.2 $ (126,934) 79,4085 -259.9% 0.84 S $ $ (135) S (1.35) 260.7 (2) 2) 0.825 -264.6% 94,201 94,201 94,251 96,287 S (50) 12,086) 0.1% -2.2 34 35 36 37 38 19 8 Accounts Receivable, net 9 Inventories 10 Current Assets 11 Total Assets 12 Current Liabilities 13 Total Liabilities 14 Total Shareholders' Equity 15 Total Liabilities & Shareholders' Equity 16 Year Ended December 31, 2020 2019 2018 138,482 140,455 71,374 352,544 456,639 338,057 912,627 789,350 524,906 1,980,600 1,960,548 1,052,944 391,272 523,246 303,237 1,304,956 1,193,195 318,636 675,644 767,353 734,308 1,980,600 1,960,548 1,052,944 17 


Step by Step Solution
There are 3 Steps involved in it
Step: 1

Get Instant Access to Expert-Tailored Solutions
See step-by-step solutions with expert insights and AI powered tools for academic success
Step: 2

Step: 3

Ace Your Homework with AI
Get the answers you need in no time with our AI-driven, step-by-step assistance
Get Started


