Solve the yellow highlighted
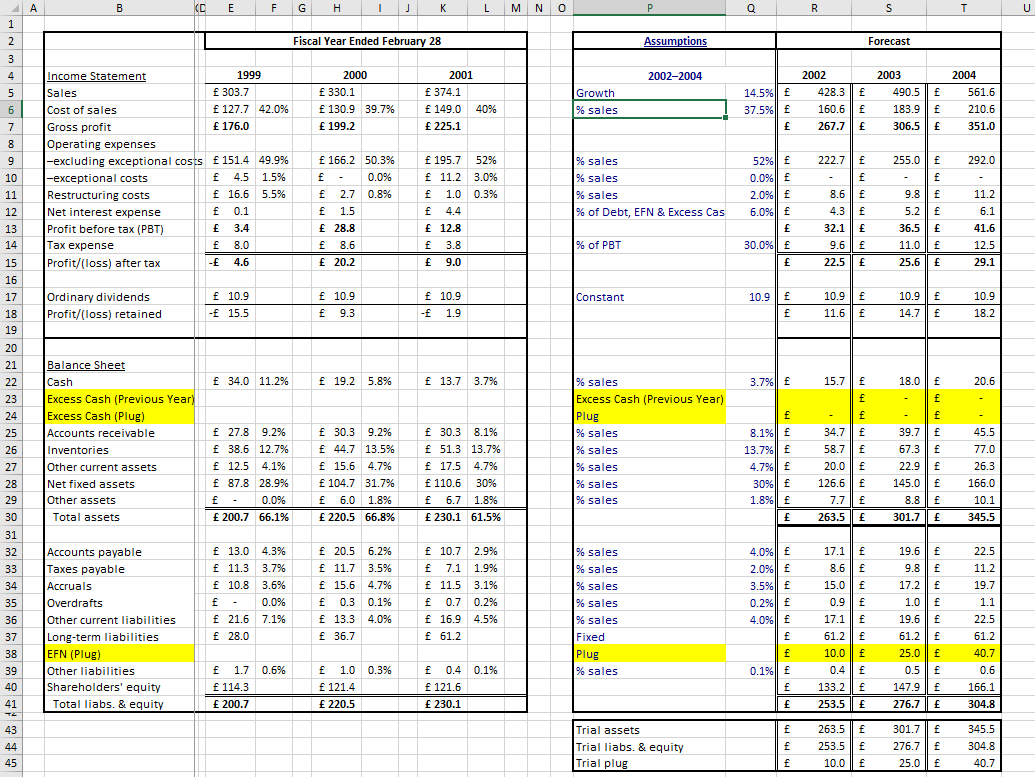
B (D E F G . 1 L L M N O Q R S T U 1 2 Fiscal Year Ended February 28 Assumptions Forecast 3 4 2002-2004 2000 330.1 f 130.9 39.7% 199.2 2001 f 374.1 f 149.0 40% 225.1 Growth % sales 14.5%|| f 37.5%|| f 2002 428.3 | f 160.6 2003 490.5 f 183.9 || E 306.5 2004 561.6 210.6 267.7 351.0 5 6 7 8 9 10 222.7 255.0 f 292.0 Income Statement 1999 Sales f 303.7 Cost of sales f 127.7 42.0% Gross profit 176.0 Operating expenses -excluding exceptional costs 151.4 49.9% -exceptional costs f 4.5 1.5% Restructuring costs f 16.6 5.5% Net interest expense f 0.1 Profit before tax (PBT) 3.4 Tax expense f 8.0 Profit/(loss) after tax - 4.6 % sales % sales f f 166.2 50.3% f 0.0% f 2.7 0.8% f 1.5 28.8 f 8.6 20.2 f 195.7 52% f 11.2 3.0% f 1.0 0.3% 4.4 12.8 f 3.8 9.0 52% 0.0% 2.0%|| 6.0%|| % sales % of Debt, EFN & Excess Cas 12 13 14 8.6 4.3 32.1 9.6 22.5 f f f f 9.8 || E 5.2 || 36.5 f 25.6 f 11.2 6.1 41.6 12.5 29.1 % of PBT 11.0 30.0%|| f 15 16 17 18 19 Constant 10.9 Ordinary dividends Profit/(loss) retained f 10.9 - 15.5 f 10.9 f 9.3 f 10.9 1.9 f f 10.9 f 11.6 | 10.9 || E 14.7 | 10.9 18.2 f 34.0 11.2% f 19.2 5.8% f 13.7 3.7% 3.79 15.7| 20.6 - 20 21 22 23 24 25 26 27 28 29 30 Balance Sheet Cash Excess Cash (Previous Year) Excess Cash (Plug) Accounts receivable Inventories Other current assets Net fixed assets Other assets Total assets f 27.8 9.2% f 38.6 12.7% f 12.5 4.1% f 87.8 28.9% f 0.0% 200.7 66.1% 30.3 9.2% 44.7 13.5% f 15.6 4.7% f 104.7 31.7% f 6.0 1.8% 220.5 66.8% f 30.3 8.1% f 51.3 13.7% f 17.5 4.7% f 110.6 30% f 6.7 1.8% 230.1 61.5% % sales Excess Cash (Previous Year) Plug % sales % sales % sales % sales % sales f 8.1%| 13.7%|| f 4.7% 30% 1.8%|| f - f 34.7 f 58.7 | 20.0 f 126.6 f 7.7 | f 263.5 f 18.0 f f 39.7 | 67.3 f 22.9 f 145.0 f 8.8 || f 301.7 f 45.5 77.0 26.3 166.0 10.1 345.5 % sales % sales 31 32 33 34 35 36 37 38 39 40 Accounts payable Taxes payable Accruals Overdrafts Other current liabilities Long-term liabilities EFN (Plug) Other liabilities Shareholders' equity Total liabs. & equity f 13.0 4.3% f 11.3 3.7% f 10.8 3.6% f 0.0% f 21.6 7.1% 28.0 f 20.5 6.2% f 11.7 3.5% f 15.6 4.7% f 0.3 0.1% f 13.3 4.0% f 36.7 % sales % sales 10.7 2.9% f 7.1 1.9% f 11.5 3.1% f 0.7 0.2% f 16.9 4.5% f 61.2 % sales Fixed Plug % sales 4.0%|| E 2.0%ll f 3.5%|| 0.2%|| 4.09 f f 0.1%|| E f 17.1 f 8.6 f 15.0 0.9 | E 17.1 f 61.2 f 10.0 f 0.4 f 133.2 f 253.5 E 19.6 | 9.8 f 17.2 | 1.0 | E 19.6 f 61.2 f f 0.5 f 147.9 f 276.7 | 22.5 11.2 19.7 1.1 22.5 61.2 40.7 0.6 166.1 304.8 25.0 f 1.7 0.6% f 114.3 200.7 f 1.0 0.3% f 121.4 220.5 f 0.4 0.1% f 121.6 230.1 41 43 44 Trial assets Trial liabs. & equity Trial plug f f f 263.5 f 253.5 || E f 10.0 f 301.7 f 276.7 | 25.0 | f 345.5 304.8 40.7 45 B (D E F G . 1 L L M N O Q R S T U 1 2 Fiscal Year Ended February 28 Assumptions Forecast 3 4 2002-2004 2000 330.1 f 130.9 39.7% 199.2 2001 f 374.1 f 149.0 40% 225.1 Growth % sales 14.5%|| f 37.5%|| f 2002 428.3 | f 160.6 2003 490.5 f 183.9 || E 306.5 2004 561.6 210.6 267.7 351.0 5 6 7 8 9 10 222.7 255.0 f 292.0 Income Statement 1999 Sales f 303.7 Cost of sales f 127.7 42.0% Gross profit 176.0 Operating expenses -excluding exceptional costs 151.4 49.9% -exceptional costs f 4.5 1.5% Restructuring costs f 16.6 5.5% Net interest expense f 0.1 Profit before tax (PBT) 3.4 Tax expense f 8.0 Profit/(loss) after tax - 4.6 % sales % sales f f 166.2 50.3% f 0.0% f 2.7 0.8% f 1.5 28.8 f 8.6 20.2 f 195.7 52% f 11.2 3.0% f 1.0 0.3% 4.4 12.8 f 3.8 9.0 52% 0.0% 2.0%|| 6.0%|| % sales % of Debt, EFN & Excess Cas 12 13 14 8.6 4.3 32.1 9.6 22.5 f f f f 9.8 || E 5.2 || 36.5 f 25.6 f 11.2 6.1 41.6 12.5 29.1 % of PBT 11.0 30.0%|| f 15 16 17 18 19 Constant 10.9 Ordinary dividends Profit/(loss) retained f 10.9 - 15.5 f 10.9 f 9.3 f 10.9 1.9 f f 10.9 f 11.6 | 10.9 || E 14.7 | 10.9 18.2 f 34.0 11.2% f 19.2 5.8% f 13.7 3.7% 3.79 15.7| 20.6 - 20 21 22 23 24 25 26 27 28 29 30 Balance Sheet Cash Excess Cash (Previous Year) Excess Cash (Plug) Accounts receivable Inventories Other current assets Net fixed assets Other assets Total assets f 27.8 9.2% f 38.6 12.7% f 12.5 4.1% f 87.8 28.9% f 0.0% 200.7 66.1% 30.3 9.2% 44.7 13.5% f 15.6 4.7% f 104.7 31.7% f 6.0 1.8% 220.5 66.8% f 30.3 8.1% f 51.3 13.7% f 17.5 4.7% f 110.6 30% f 6.7 1.8% 230.1 61.5% % sales Excess Cash (Previous Year) Plug % sales % sales % sales % sales % sales f 8.1%| 13.7%|| f 4.7% 30% 1.8%|| f - f 34.7 f 58.7 | 20.0 f 126.6 f 7.7 | f 263.5 f 18.0 f f 39.7 | 67.3 f 22.9 f 145.0 f 8.8 || f 301.7 f 45.5 77.0 26.3 166.0 10.1 345.5 % sales % sales 31 32 33 34 35 36 37 38 39 40 Accounts payable Taxes payable Accruals Overdrafts Other current liabilities Long-term liabilities EFN (Plug) Other liabilities Shareholders' equity Total liabs. & equity f 13.0 4.3% f 11.3 3.7% f 10.8 3.6% f 0.0% f 21.6 7.1% 28.0 f 20.5 6.2% f 11.7 3.5% f 15.6 4.7% f 0.3 0.1% f 13.3 4.0% f 36.7 % sales % sales 10.7 2.9% f 7.1 1.9% f 11.5 3.1% f 0.7 0.2% f 16.9 4.5% f 61.2 % sales Fixed Plug % sales 4.0%|| E 2.0%ll f 3.5%|| 0.2%|| 4.09 f f 0.1%|| E f 17.1 f 8.6 f 15.0 0.9 | E 17.1 f 61.2 f 10.0 f 0.4 f 133.2 f 253.5 E 19.6 | 9.8 f 17.2 | 1.0 | E 19.6 f 61.2 f f 0.5 f 147.9 f 276.7 | 22.5 11.2 19.7 1.1 22.5 61.2 40.7 0.6 166.1 304.8 25.0 f 1.7 0.6% f 114.3 200.7 f 1.0 0.3% f 121.4 220.5 f 0.4 0.1% f 121.6 230.1 41 43 44 Trial assets Trial liabs. & equity Trial plug f f f 263.5 f 253.5 || E f 10.0 f 301.7 f 276.7 | 25.0 | f 345.5 304.8 40.7 45