Answered step by step
Verified Expert Solution
Link Copied!

Question

1 Approved Answer

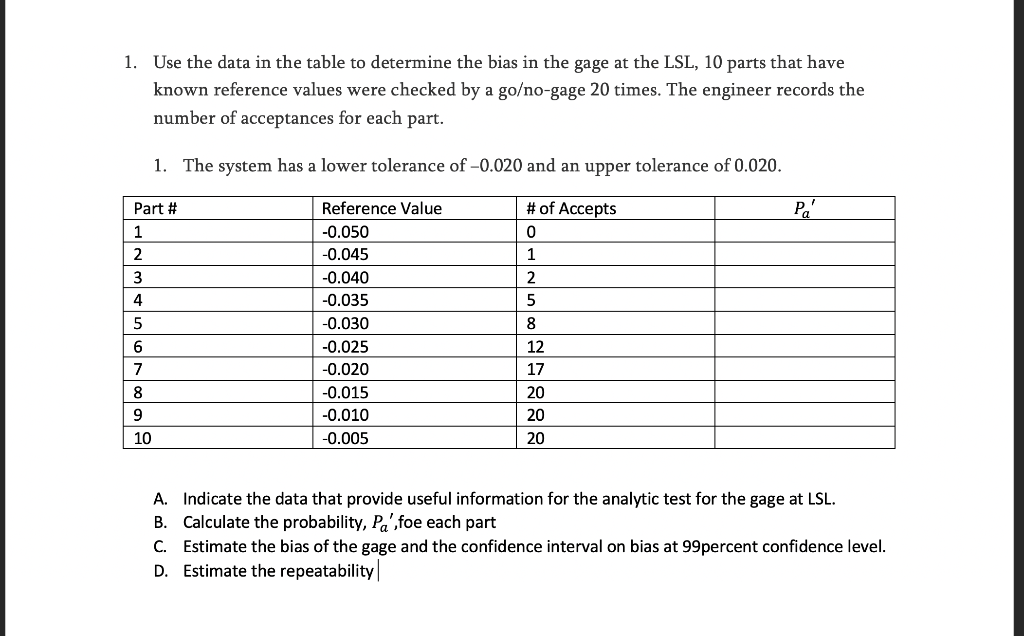
Solve these. 1. Use the data in the table to determine the bias in the gage at the LSL, 10 parts that have known reference

Solve these.

image text in transcribedimage text in transcribed
1. Use the data in the table to determine the bias in the gage at the LSL, 10 parts that have known reference values were checked by a googage 20 times. The engineer records the number of acceptances for each part. 1. The system has a lower tolerance of 0.020 and an upper tolerance of 0.020. Part a Reference Value it of Accepts PR' 1 41050 0 2 1 3 2 4 5 5 8 6 7 8 9 10 43.005 20 A. Indicate the data that provide useful information for the analytic test for the gage at LSL. B. Calculate the probability, Pa'oe each part C. Estimate the bias of the gage and the condence interval on bias at 99percent condence level. D. Estimate the repeatabilityl 3. The following table gives one measurement each for ve parts over 25 weeks Part 1 Part 2 Part 3 Part 4 Part 5 0.5045 0.4975 0.5031 0.5021 0.5022 0.4968 0.4966 0.4995 0.4990 0.5031 0.4970 0.4982 0.5009 0.5050 0.5017 0.5016 0.4978 0.4996 0.4954 0.5006 0.5018 0.4951 0.4980 0.5028 0.5017 0.5021 0.5013 0.5030 0.4951 0.4979 0.4996 0.4961 0.4964 0.4995 0.5010 0.4967 0.5034 0.5024 0.4977 0.5027 0.5031 0.4985 0.5048 0.5008 0.5050 0.4984 0.5035 0.4956 0.4986 0.5000 0.5044 0.5010 0.4957 0.4960 0.5041 0.4985 0.5012 0.4994 0.4954 0.4951 0.4992 0.5010 0.5014 0.5031 0.4985 0.4955 0.5014 0.5022 0.5046 0.4992 0.5040 0.5018 0.5015 0.4966 0.5002 0.5023 0.4967 0.4977 0.4974 0.4986 0.5004 0.4999 0.5017 0.5010 0.5031 0.5044 0.5031 0.5047 0.5047 0.4962 0.5020 0.4970 0.4992 0.5010 0.4995 0.4998 0.504 0.4973 0.4973 1 0. 5034 0.49 73 0.50 30 0.49 50 l-I 0.493 0.49 6 0.4994 0.5047 0.4986 0.5000 0.4994 0.4980 0. 5007 H .4 MID 21 HI 0.49 77 0. 5016 A. Using the Range for each week, estimate the standard deviation for within the parts. B. Using moving range for the weeklyr means {using three consecutive weeks data; estimate the standard deviation between the weeks C. Using results from parts A and 8, estimate the combined standard deviation of within and between the parts D. Estimate the overall standard deviation of the measurement system. E. Assuming that the upper and lower specication limit on the values are 0.492 and 0.508, estimate the potential capability of the measurement system F. Estimate the performance capability, P9,, ,of the measurement system

Step by Step Solution

There are 3 Steps involved in it

Step: 1

blur-text-image

Get Instant Access to Expert-Tailored Solutions

See step-by-step solutions with expert insights and AI powered tools for academic success

Step: 2

blur-text-image

Step: 3

blur-text-image

Ace Your Homework with AI

Get the answers you need in no time with our AI-driven, step-by-step assistance

Get Started

Recommended Textbook for

More Books

Students also viewed these Mathematics questions

Question

6. Conclude with the same strength as in the introduction

Answered: 1 week ago

Question

7. Prepare an effective outline

Answered: 1 week ago