Question: solve these practice problems The relative conductivity of a semiconductor device is determined by the amount of impurity doped into the device during its manufacture.
solve these practice problems
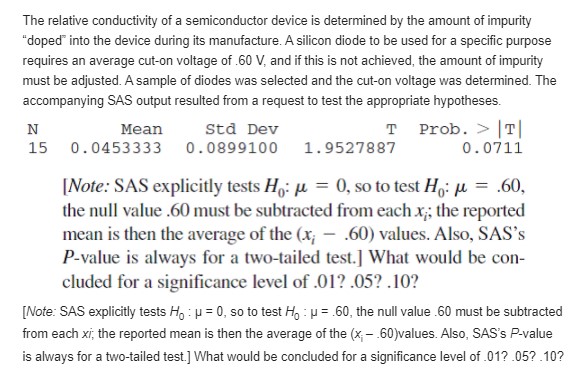
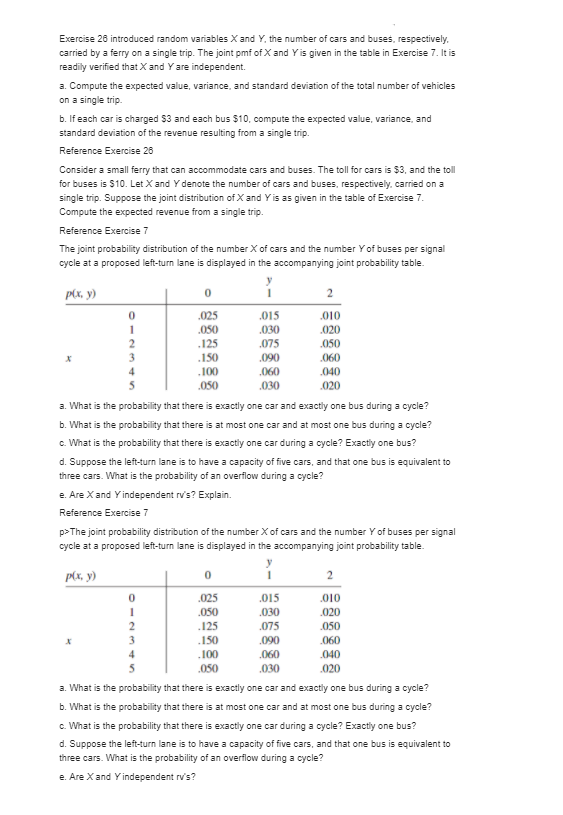
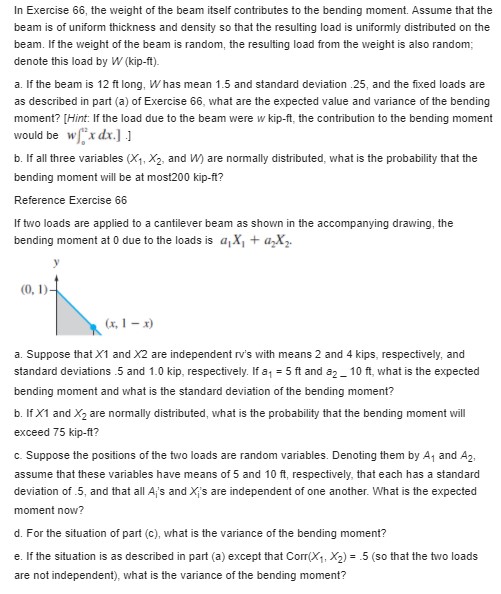
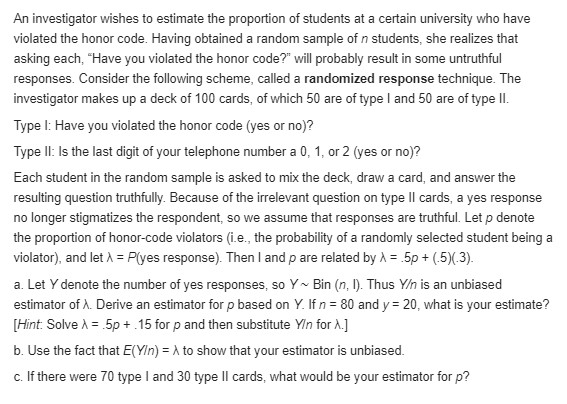
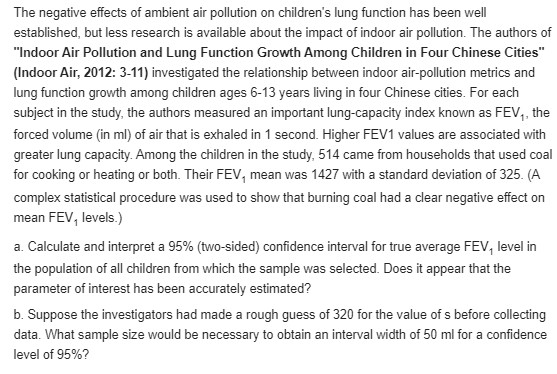
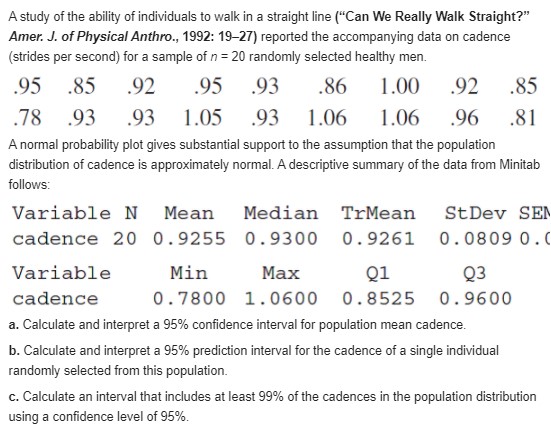
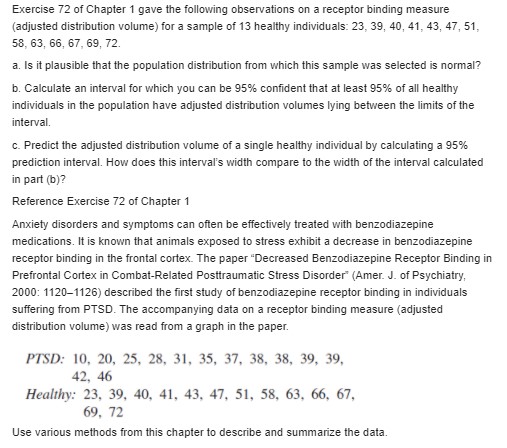
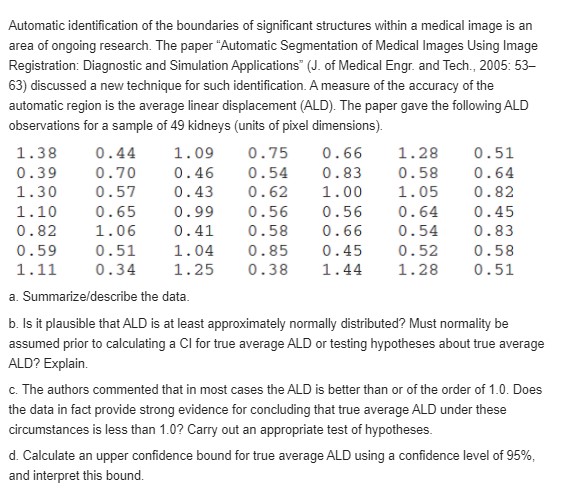
The relative conductivity of a semiconductor device is determined by the amount of impurity "doped" into the device during its manufacture. A silicon diode to be used for a specific purpose requires an average cut-on voltage of .60 V, and if this is not achieved, the amount of impurity must be adjusted. A sample of diodes was selected and the cut-on voltage was determined. The accompanying SAS output resulted from a request to test the appropriate hypotheses. N Mean Std Dev T Prob. > T 15 0.0453333 0.0899100 1.9527887 0 . 0711 [Note: SAS explicitly tests Ho: u = 0, so to test H: u = .60, the null value .60 must be subtracted from each x ; the reported mean is then the average of the (x; - .60) values. Also, SAS's P-value is always for a two-tailed test.] What would be con- cluded for a significance level of .01? .05? .10? [Note: SAS explicitly tests Ho : p = 0, so to test Ho : p = .60, the null value .60 must be subtracted from each xi; the reported mean is then the average of the (x - .60)values. Also, SAS's P-value is always for a two-tailed test.] What would be concluded for a significance level of .01? .05? .10?Exercise 26 introduced random variables X and Y, the number of cars and buses, respectively. carried by a ferry on a single trip. The joint pmf of X and Y is given in the table in Exercise 7. It is readily verified that X and Y are independent. a. Compute the expected value, variance, and standard deviation of the total number of vehicles on a single trip. b. If each car is charged $3 and each bus $10, compute the expected value, variance, and standard deviation of the revenue resulting from a single trip. Reference Exercise 26 Consider a small ferry that can accommodate cars and buses. The toll for cars is $3, and the toll for buses is $10. Let X and Y denote the number of cars and buses, respectively, carried on a single trip. Suppose the joint distribution of X and Y is as given in the table of Exercise 7. Compute the expected revenue from a single trip. Reference Exercise 7 The joint probability distribution of the number X of cars and the number Y of buses per signal cycle at a proposed left-turn lane is displayed in the accompanying joint probability table. p(x. y) 0 2 025 015 010 050 030 020 UN- 125 .075 .050 .150 090 060 .100 060 .040 050 030 020 a. What is the probability that there is exactly one car and exactly one bus during a cycle? b. What is the probability that there is at most one car and at most one bus during a cycle? c. What is the probability that there is exactly one car during a cycle? Exactly one bus? d. Suppose the left-turn lane is to have a capacity of five cars, and that one bus is equivalent to three cars. What is the probability of an overflow during a cycle? e. Are X and Y independent rv's? Explain. Reference Exercise 7 p>The joint probability distribution of the number X of cars and the number Y of buses per signal cycle at a proposed left-turn lane is displayed in the accompanying joint probability table. p(x, y) 0 2 025 .015 010 .050 .030 .020 W N - .125 075 .050 150 090 .060 100 060 040 050 030 .020 a. What is the probability that there is exactly one car and exactly one bus during a cycle? b. What is the probability that there is at most one car and at most one bus during a cycle? c. What is the probability that there is exactly one car during a cycle? Exactly one bus? d. Suppose the left-turn lane is to have a capacity of five cars, and that one bus is equivalent to three cars. What is the probability of an overflow during a cycle? e. Are X and Yindependent rv's?In Exercise 66, the weight of the beam itself contributes to the bending moment. Assume that the beam is of uniform thickness and density so that the resulting load is uniformly distributed on the beam. If the weight of the beam is random, the resulting load from the weight is also random; denote this load by W (kip-ft). a. If the beam is 12 ft long, Whas mean 1.5 and standard deviation .25, and the fixed loads are as described in part (a) of Exercise 66, what are the expected value and variance of the bending moment? [Hint: If the load due to the beam were w kip-ft, the contribution to the bending moment would be w xdx.] ] b. If all three variables (X1, X2, and W) are normally distributed, what is the probability that the bending moment will be at most200 kip-ft? Reference Exercise 66 If two loads are applied to a cantilever beam as shown in the accompanying drawing, the bending moment at 0 due to the loads is a, X, + a,X2. (0, 1)- (x, 1 - x) a. Suppose that X1 and X2 are independent rv's with means 2 and 4 kips, respectively, and standard deviations .5 and 1.0 kip, respectively. If a, = 5 ft and a2 _ 10 ft, what is the expected bending moment and what is the standard deviation of the bending moment? b. If X1 and X2 are normally distributed, what is the probability that the bending moment will exceed 75 kip-ft? c. Suppose the positions of the two loads are random variables. Denoting them by A, and A2, assume that these variables have means of 5 and 10 ft, respectively, that each has a standard deviation of .5, and that all Aj's and Xi's are independent of one another. What is the expected moment now? d. For the situation of part (c), what is the variance of the bending moment? e. If the situation is as described in part (a) except that Corr(X,, X2) = .5 (so that the two loads are not independent), what is the variance of the bending moment?An investigator wishes to estimate the proportion of students at a certain university who have violated the honor code. Having obtained a random sample of n students, she realizes that asking each, "Have you violated the honor code?" will probably result in some untruthful responses. Consider the following scheme, called a randomized response technique. The investigator makes up a deck of 100 cards, of which 50 are of type I and 50 are of type II. Type I: Have you violated the honor code (yes or no)? Type II: Is the last digit of your telephone number a 0, 1, or 2 (yes or no)? Each student in the random sample is asked to mix the deck, draw a card, and answer the resulting question truthfully. Because of the irrelevant question on type II cards, a yes response no longer stigmatizes the respondent, so we assume that responses are truthful. Let p denote the proportion of honor-code violators (i.e., the probability of a randomly selected student being a violator), and let A = P(yes response). Then I and p are related by A = .5p + (.5)(.3). a. Let Y denote the number of yes responses, so Y ~ Bin (n, I). Thus Y is an unbiased estimator of A. Derive an estimator for p based on Y. Ifn = 80 and y = 20, what is your estimate? [Hint: Solve ) = .5p + .15 for p and then substitute YIn for A.] b. Use the fact that E(VIn) = A to show that your estimator is unbiased. c. If there were 70 type I and 30 type II cards, what would be your estimator for p?The negative effects of ambient air pollution on children's lung function has been well established, but less research is available about the impact of indoor air pollution. The authors of "Indoor Air Pollution and Lung Function Growth Among Children in Four Chinese Cities" (Indoor Air, 2012: 3-11) investigated the relationship between indoor air-pollution metrics and lung function growth among children ages 6-13 years living in four Chinese cities. For each subject in the study, the authors measured an important lung-capacity index known as FEV,, the forced volume (in ml) of air that is exhaled in 1 second. Higher FEV1 values are associated with greater lung capacity. Among the children in the study, 514 came from households that used coal for cooking or heating or both. Their FEV, mean was 1427 with a standard deviation of 325. (A complex statistical procedure was used to show that burning coal had a clear negative effect on mean FEV, levels.) a. Calculate and interpret a 95% (two-sided) confidence interval for true average FEV, level in the population of all children from which the sample was selected. Does it appear that the parameter of interest has been accurately estimated? b. Suppose the investigators had made a rough guess of 320 for the value of s before collecting data. What sample size would be necessary to obtain an interval width of 50 ml for a confidence level of 95%?A study of the ability of individuals to walk in a straight line ("Can We Really Walk Straight?" Amer. J. of Physical Anthro., 1992: 19-27) reported the accompanying data on cadence (strides per second) for a sample of n = 20 randomly selected healthy men. 95 .85 92 95 .93 .86 1.00 92 .85 78 93 93 1.05 93 1.06 1.06 96 .81 A normal probability plot gives substantial support to the assumption that the population distribution of cadence is approximately normal. A descriptive summary of the data from Minitab follows: Variable N Mean Median TrMean StDev SEM cadence 20 0. 9255 0. 9300 0. 9261 0. 0809 0. Variable Min Max Q1 Q3 cadence 0 . 7800 1. 0600 0. 8525 0. 9600 a. Calculate and interpret a 95% confidence interval for population mean cadence. b. Calculate and interpret a 95% prediction interval for the cadence of a single individual randomly selected from this population. c. Calculate an interval that includes at least 99% of the cadences in the population distribution using a confidence level of 95%.Exercise 72 of Chapter 1 gave the following observations on a receptor binding measure (adjusted distribution volume) for a sample of 13 healthy individuals: 23, 39, 40, 41, 43, 47, 51, 58, 63, 66, 67, 69, 72. a. Is it plausible that the population distribution from which this sample was selected is normal? b. Calculate an interval for which you can be 95% confident that at least 95% of all healthy individuals in the population have adjusted distribution volumes lying between the limits of the interval. c. Predict the adjusted distribution volume of a single healthy individual by calculating a 95% prediction interval. How does this interval's width compare to the width of the interval calculated in part (b)? Reference Exercise 72 of Chapter 1 Anxiety disorders and symptoms can often be effectively treated with benzodiazepine medications. It is known that animals exposed to stress exhibit a decrease in benzodiazepine receptor binding in the frontal cortex. The paper "Decreased Benzodiazepine Receptor Binding in Prefrontal Cortex in Combat-Related Posttraumatic Stress Disorder" (Amer. J. of Psychiatry, 2000: 1120-1126) described the first study of benzodiazepine receptor binding in individuals suffering from PTSD. The accompanying data on a receptor binding measure (adjusted distribution volume) was read from a graph in the paper. PTSD: 10, 20, 25, 28, 31, 35, 37, 38, 38, 39, 39, 42. 46 Healthy: 23, 39, 40, 41, 43, 47, 51, 58, 63, 66. 67, 69. 72 Use various methods from this chapter to describe and summarize the data.Automatic identification of the boundaries of significant structures within a medical image is an area of ongoing research. The paper "Automatic Segmentation of Medical Images Using Image Registration: Diagnostic and Simulation Applications" (J. of Medical Engr. and Tech., 2005: 53- 63) discussed a new technique for such identification. A measure of the accuracy of the automatic region is the average linear displacement (ALD). The paper gave the following ALD observations for a sample of 49 kidneys (units of pixel dimensions). 1.38 0 . 44 1 . 09 0. 75 0. 66 1. 28 0 . 51 0.39 0.70 0. 46 0 . 54 0. 83 0. 58 0 . 64 1.30 0.57 0. 43 0 . 62 1.00 1 . 05 0. 82 1. 10 0. 65 0. 99 0. 56 0 . 56 0. 64 0 . 45 0 . 82 1. 06 0 . 41 0 . 58 0 . 66 0. 54 0. 83 0 . 59 0 . 51 1 . 04 0 . 85 0 . 45 0.52 0 . 58 1. 11 0.34 1. 25 0.38 1 . 44 1. 28 0 . 51 a. Summarize/describe the data. b. Is it plausible that ALD is at least approximately normally distributed? Must normality be assumed prior to calculating a Cl for true average ALD or testing hypotheses about true average ALD? Explain. c. The authors commented that in most cases the ALD is better than or of the order of 1.0. Does the data in fact provide strong evidence for concluding that true average ALD under these circumstances is less than 1.0? Carry out an appropriate test of hypotheses. d. Calculate an upper confidence bound for true average ALD using a confidence level of 95%, and interpret this bound
Step by Step Solution
There are 3 Steps involved in it

Get step-by-step solutions from verified subject matter experts


