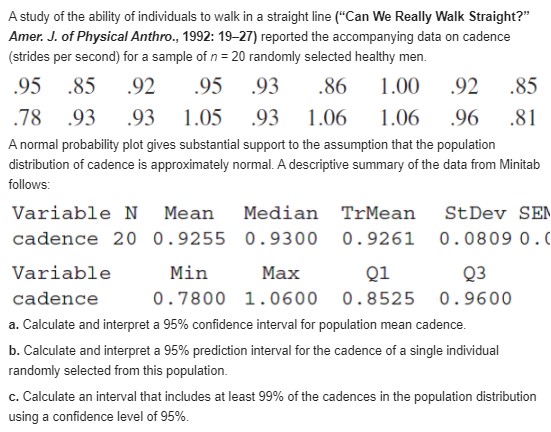
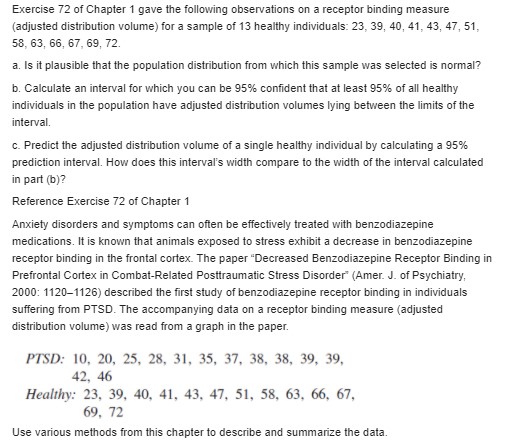
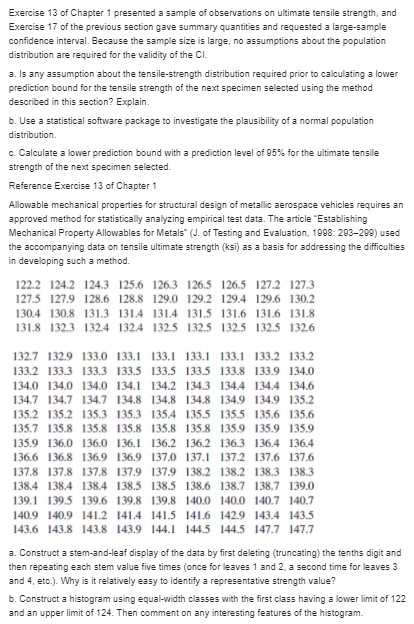
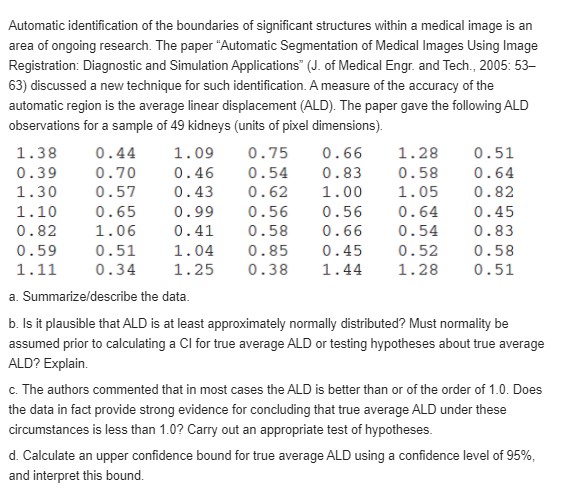
solve these problems
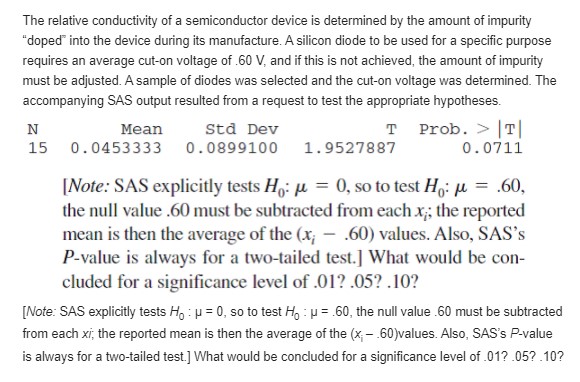
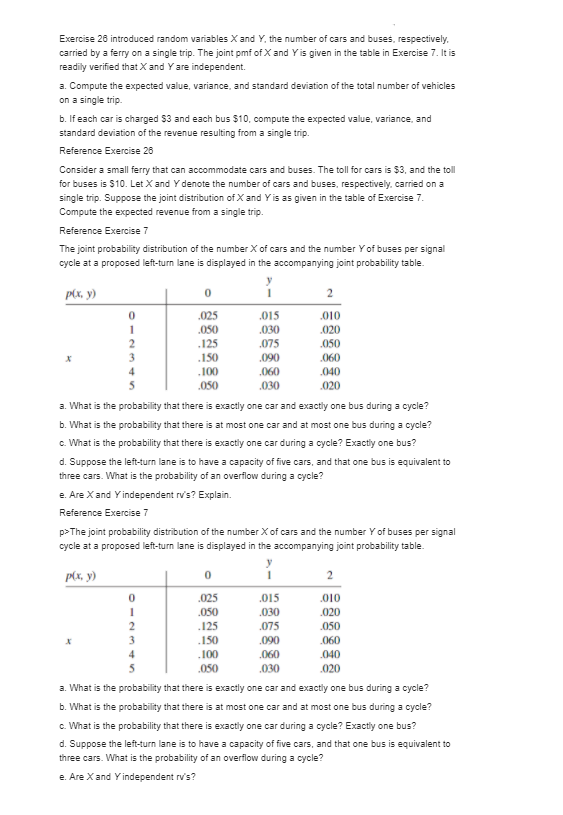
The relative conductivity of a semiconductor device is determined by the amount of impurity "doped" into the device during its manufacture. A silicon diode to be used for a specific purpose requires an average cut-on voltage of .60 V, and if this is not achieved, the amount of impurity must be adjusted. A sample of diodes was selected and the cut-on voltage was determined. The accompanying SAS output resulted from a request to test the appropriate hypotheses. N Mean Std Dev T Prob. > T 15 0.0453333 0.0899100 1.9527887 0 . 0711 [Note: SAS explicitly tests Ho: u = 0, so to test H: u = .60, the null value .60 must be subtracted from each x ; the reported mean is then the average of the (x; - .60) values. Also, SAS's P-value is always for a two-tailed test.] What would be con- cluded for a significance level of .01? .05? .10? [Note: SAS explicitly tests Ho : p = 0, so to test Ho : p = .60, the null value .60 must be subtracted from each xi; the reported mean is then the average of the (x - .60)values. Also, SAS's P-value is always for a two-tailed test.] What would be concluded for a significance level of .01? .05? .10?Exercise 26 introduced random variables X and Y, the number of cars and buses, respectively. carried by a ferry on a single trip. The joint pmf of X and Y is given in the table in Exercise 7. It is readily verified that X and Y are independent. a. Compute the expected value, variance, and standard deviation of the total number of vehicles on a single trip. b. If each car is charged $3 and each bus $10, compute the expected value, variance, and standard deviation of the revenue resulting from a single trip. Reference Exercise 26 Consider a small ferry that can accommodate cars and buses. The toll for cars is $3, and the toll for buses is $10. Let X and Y denote the number of cars and buses, respectively, carried on a single trip. Suppose the joint distribution of X and Y is as given in the table of Exercise 7. Compute the expected revenue from a single trip. Reference Exercise 7 The joint probability distribution of the number X of cars and the number Y of buses per signal cycle at a proposed left-turn lane is displayed in the accompanying joint probability table. p(x. y) 0 2 025 015 010 050 030 020 UN- 125 .075 .050 .150 090 060 .100 060 .040 050 030 020 a. What is the probability that there is exactly one car and exactly one bus during a cycle? b. What is the probability that there is at most one car and at most one bus during a cycle? c. What is the probability that there is exactly one car during a cycle? Exactly one bus? d. Suppose the left-turn lane is to have a capacity of five cars, and that one bus is equivalent to three cars. What is the probability of an overflow during a cycle? e. Are X and Y independent rv's? Explain. Reference Exercise 7 p>The joint probability distribution of the number X of cars and the number Y of buses per signal cycle at a proposed left-turn lane is displayed in the accompanying joint probability table. p(x, y) 0 2 025 .015 010 .050 .030 .020 W N - .125 075 .050 150 090 .060 100 060 040 050 030 .020 a. What is the probability that there is exactly one car and exactly one bus during a cycle? b. What is the probability that there is at most one car and at most one bus during a cycle? c. What is the probability that there is exactly one car during a cycle? Exactly one bus? d. Suppose the left-turn lane is to have a capacity of five cars, and that one bus is equivalent to three cars. What is the probability of an overflow during a cycle? e. Are X and Yindependent rv's?a. Let X, have a chi-squared distribution with parameter v1 (see Section 4.4), and let X, be independent of X, and have a chi-squared distribution with parameter v2- Use the technique of Example 5.21 to show that X, + X, has a chi-squared distribution with parameter V1 _ V2- b. In Exercise 71 of Chapter 4, you were asked to show that if Z is a standard normal rv, then Zz has a chi-squared distribution with v = 1. Let Z,, Z 2. .. .. Z, ben independent standard normal ry's. What is the distribution of X? Justify your answer. c. Let X1, . . . . X, be a random sample from a normal distribution with mean m and variance of. What is the distribution of the sum 1 ? Justify your answer. Reference example 5.21 Service time for a certain type of bank transaction is a random variable having an exponential distribution with parameter I. Suppose X1 and X2 are service times for two different customers, assumed independent of each other. Consider the total service time To = X1 + X2 for the two customers, also a statistic. The cdf of 7, is, for f 2 0, X2 Reference exercise 7 in chapter 4 The time X (min) for a lab assistant to prepare the equipment for a certain experiment is believed to have a uniform distribution with A = 25 and B =35. a. Determine the pdf of X and sketch the corresponding density curve. b. What is the probability that preparation time exceeds 33 min? c. What is the probability that preparation time is within 2 min of the mean time? [Hint. Identify u from the graph of f(x).] d. For any a such that 25
