

Question: solve these problems with step by step explanation The article from which the data in Exercise 1 was extracted also gave the accompanying strength observations
solve these problems with step by step explanation
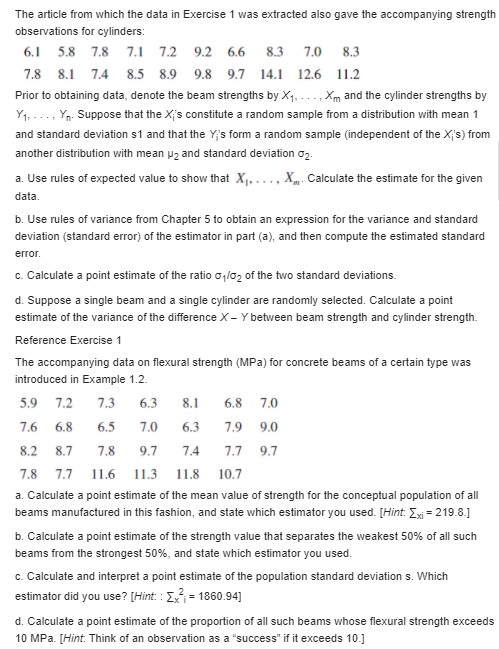
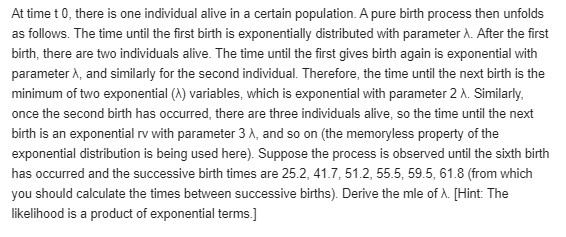
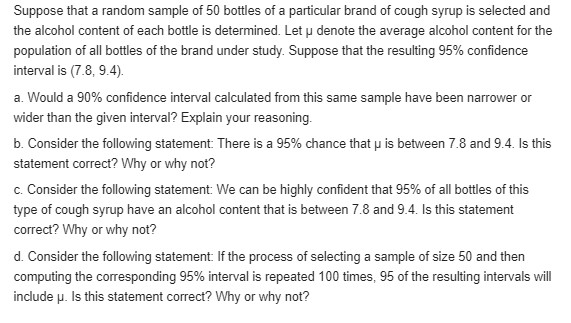
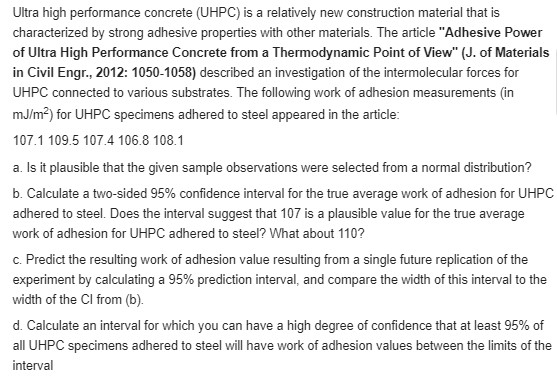
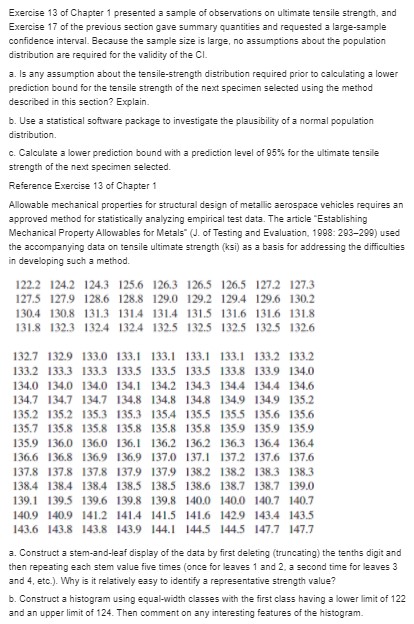
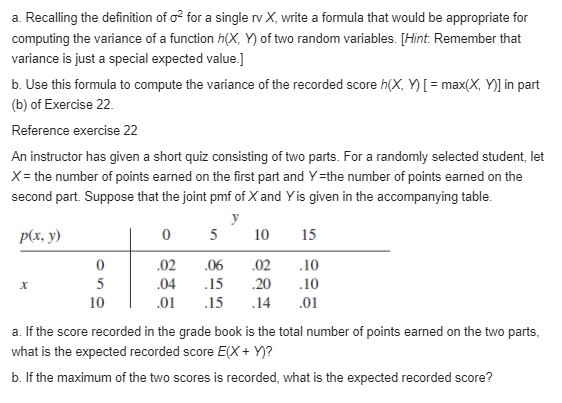
The article from which the data in Exercise 1 was extracted also gave the accompanying strength observations for cylinders: 6.1 5.8 7.8 7.1 7.2 9.2 6.6 8.3 7.0 8.3 7.8 8.1 7.4 8.5 8.9 9.8 9.7 14.1 12.6 11.2 Prior to obtaining data, denote the beam strengths by X1, .. .. Xm and the cylinder strengths by Y1. ... . Yo. Suppose that the X's constitute a random sample from a distribution with mean 1 and standard deviation s1 and that the Y's form a random sample (independent of the Xi's) from another distribution with mean uz and standard deviation 02. a. Use rules of expected value to show that X. . . . . X,. Calculate the estimate for the given data. b. Use rules of variance from Chapter 5 to obtain an expression for the variance and standard deviation (standard error) of the estimator in part (a), and then compute the estimated standard error. c. Calculate a point estimate of the ratio of/02 of the two standard deviations. d. Suppose a single beam and a single cylinder are randomly selected. Calculate a point estimate of the variance of the difference X - Y between beam strength and cylinder strength. Reference Exercise 1 The accompanying data on flexural strength (MPa) for concrete beams of a certain type was introduced in Example 1.2. 5.9 7.2 7.3 6.3 8.1 6.8 7.0 7.6 6.8 6.5 7.0 6.3 7.9 9.0 8.2 8.7 7.8 9.7 7.4 7.7 9.7 7.8 7.7 11.6 11.3 11.8 10.7 a. Calculate a point estimate of the mean value of strength for the conceptual population of all beams manufactured in this fashion, and state which estimator you used. [Hint: Ex; = 219.8.] b. Calculate a point estimate of the strength value that separates the weakest 50% of all such beams from the strongest 50%, and state which estimator you used. c. Calculate and interpret a point estimate of the population standard deviation s. Which estimator did you use? [Hint: : Ex ; = 1860.94] d. Calculate a point estimate of the proportion of all such beams whose flexural strength exceeds 10 MPa. [Hint: Think of an observation as a "success" if it exceeds 10.]At time t 0, there is one individual alive in a certain population. A pure birth process then unfolds as follows. The time until the first birth is exponentially distributed with parameter A. After the first birth, there are two individuals alive. The time until the first gives birth again is exponential with parameter A, and similarly for the second individual. Therefore, the time until the next birth is the minimum of two exponential (A) variables, which is exponential with parameter 2 A. Similarly, once the second birth has occurred, there are three individuals alive, so the time until the next birth is an exponential ry with parameter 3 A, and so on (the memoryless property of the exponential distribution is being used here). Suppose the process is observed until the sixth birth has occurred and the successive birth times are 25.2, 41.7, 51.2, 55.5, 59.5, 61.8 (from which you should calculate the times between successive births). Derive the mle of A. [Hint: The likelihood is a product of exponential terms.]Suppose that a random sample of 50 bottles of a particular brand of cough syrup is selected and the alcohol content of each bottle is determined. Let p denote the average alcohol content for the population of all bottles of the brand under study. Suppose that the resulting 95% confidence interval is (7.8, 9.4). a. Would a 90% confidence interval calculated from this same sample have been narrower or wider than the given interval? Explain your reasoning. b. Consider the following statement: There is a 95% chance that p is between 7.8 and 9.4. Is this statement correct? Why or why not? c. Consider the following statement: We can be highly confident that 95% of all bottles of this type of cough syrup have an alcohol content that is between 7.8 and 9.4. Is this statement correct? Why or why not? d. Consider the following statement: If the process of selecting a sample of size 50 and then computing the corresponding 95% interval is repeated 100 times, 95 of the resulting intervals will include p. Is this statement correct? Why or why not?Ultra high performance concrete (UHPC) is a relatively new construction material that is characterized by strong adhesive properties with other materials. The article "Adhesive Power of Ultra High Performance Concrete from a Thermodynamic Point of View" (J. of Materials in Civil Engr., 2012: 1050-1058) described an investigation of the intermolecular forces for UHPC connected to various substrates. The following work of adhesion measurements (in mJ/m2) for UHPC specimens adhered to steel appeared in the article: 107.1 109.5 107.4 106.8 108.1 a. Is it plausible that the given sample observations were selected from a normal distribution? b. Calculate a two-sided 95% confidence interval for the true average work of adhesion for UHPC adhered to steel. Does the interval suggest that 107 is a plausible value for the true average work of adhesion for UHPC adhered to steel? What about 110? c. Predict the resulting work of adhesion value resulting from a single future replication of the experiment by calculating a 95% prediction interval, and compare the width of this interval to the width of the Cl from (b). d. Calculate an interval for which you can have a high degree of confidence that at least 95% of all UHPC specimens adhered to steel will have work of adhesion values between the limits of the intervalExercise 13 of Chapter 1 presented a sample of observations on ultimate tensile strength, and Exercise 17 of the previous section gave summary quantities and requested a large-sample confidence interval. Because the sample size is large, no assumptions about the population distribution are required for the validity of the CI. 3. Is any assumption about the tensile-strength distribution required prior to calculating a lower prediction bound for the tensile strength of the next specimen selected using the method described in this section? Explain. b. Use a statistical software package to investigate the plausibility of a normal population distribution. c. Calculate a lower prediction bound with a prediction level of 95%% for the ultimate tensile strength of the next specimen selected. Reference Exercise 13 of Chapter 1 Allowable mechanical properties for structural design of metallic aerospace vehicles requires an approved method for statistically analyzing empirical test data. The article "Establishing Mechanical Property Allowables for Metals" (J. of Testing and Evaluation, 1098: 203-290) used the accompanying data on tensile ultimate strength (ksi) as a basis for addressing the difficulties in developing such a method. 122.2 124.2 124.3 125.6 126.3 126.5 126.5 127.2 127.3 127.5 127.9 128.6 128.8 129.0 129.2 129.4 129.6 130.2 130.4 130.8 131.3 131.4 131.4 131.5 131.6 131.6 131.8 131.8 132.3 132.4 1324 132.5 132.5 132.5 132.5 132.6 132.7 132.9 133.0 133.1 133.1 133.1 133.1 133.2 133.2 133.2 133.3 133.3 133.5 1335 133.5 133.8 133.9 134.0 134.0 134.0 134.0 134.1 134.2 134.3 134.4 134.4 134.6 134.7 134.7 134.7 134.8 134.8 134.8 134.9 134.9 135.2 135.2 135.2 135.3 135.3 1354 135.5 135.5 135.6 135.6 135.7 135.8 135.8 135.8 135.8 135.8 135.9 135.9 135.9 135.9 136.0 136.0 136.1 136.2 136.2 136.3 136.4 136.4 136.6 136.8 136.9 136.9 137.0 137.1 137.2 137.6 137.6 137.8 137.8 137.8 137.9 137.9 138.2 138.2 1383 138.3 138.4 1384 138.4 138.5 138.5 138.6 138.7 138.7 139.0 139.1 139.5 139.6 139.8 139.8 140.0 140.0 140.7 140.7 140.9 140.9 141.2 141.4 141.5 141.6 142.9 143.4 143.5 143.6 143.8 143.8 143.9 144.1 1445 1445 147.7 147.7 a. Construct a stem-and-leaf display of the data by first deleting (truncating) the tenths digit and then repeating each stem value five times (once for leaves 1 and 2, a second time for leaves 3 and 4, etc.). Why is it relatively easy to identify a representative strength value? b. Construct a histogram using equal-width classes with the first class having a lower limit of 122 and an upper limit of 124. Then comment on any interesting features of the histogram.a. Recalling the definition of of for a single rv X, write a formula that would be appropriate for computing the variance of a function h(X, Y) of two random variables. [Hint. Remember that variance is just a special expected value.] b. Use this formula to compute the variance of the recorded score h(X, Y) [ = max(X, Y)] in part (b) of Exercise 22. Reference exercise 22 An instructor has given a short quiz consisting of two parts. For a randomly selected student, let X = the number of points earned on the first part and Y=the number of points earned on the second part. Suppose that the joint pmf of X and Y is given in the accompanying table. y p(x. y) 5 10 15 02 .06 .02 .10 X 5 .04 .15 .20 10 .01 .15 .14 .01 a. If the score recorded in the grade book is the total number of points earned on the two parts, what is the expected recorded score E(X + Y)? b. If the maximum of the two scores is recorded, what is the expected recorded score
Step by Step Solution
There are 3 Steps involved in it

Get step-by-step solutions from verified subject matter experts