Solve these questions well.
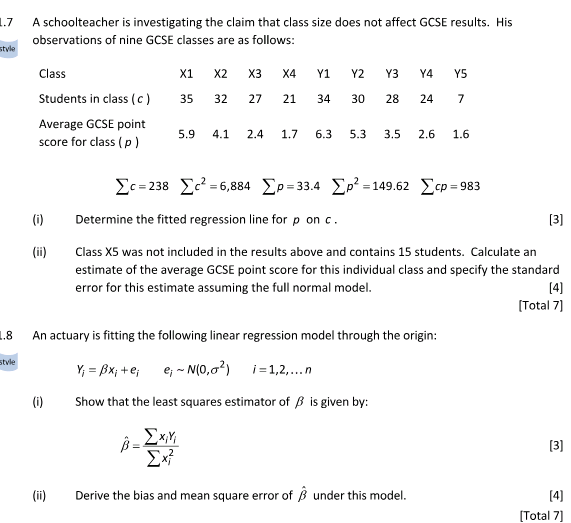
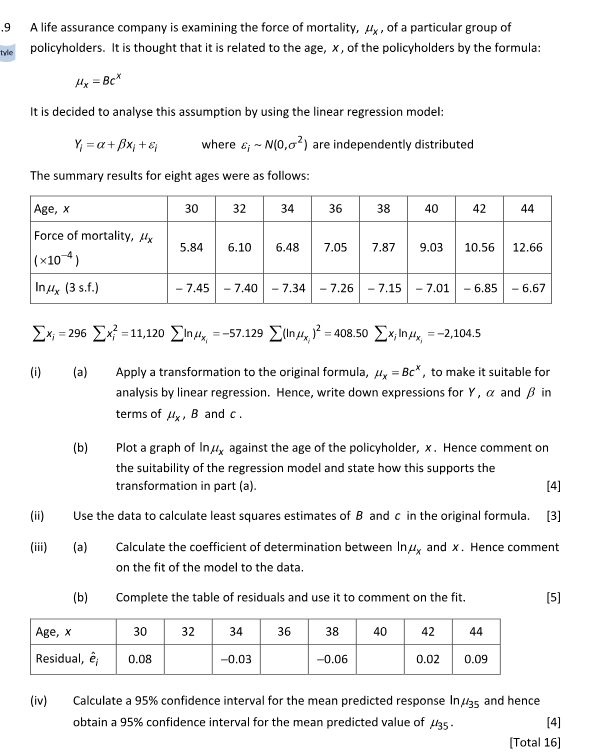
7 A schoolteacher is investigating the claim that class size does not affect GCSE results. His observations of nine GCSE classes are as follows: style Class X1 X2 X3 X4 Y1 Y2 Y3 Y4 Y5 Students in class ( c ) 35 32 27 21 34 30 28 24 7 Average GCSE point score for class ( p ) 5.9 4.1 2.4 1.7 6.3 5.3 3.5 2.6 1.6 o=238 )c' =6,884 p=33.4 _p' =149.62 \\cp=983 Determine the fitted regression line for p on c. [3] Class X5 was not included in the results above and contains 15 students. Calculate an estimate of the average GCSE point score for this individual class and specify the standard error for this estimate assuming the full normal model. [4] [Total 7] .8 An actuary is fitting the following linear regression model through the origin: style Y, = BX; te; e; - N(0,G ) i=1,2....n (0) Show that the least squares estimator of / is given by: [3] (ii) Derive the bias and mean square error of / under this model. [4] [Total 7]9 A life assurance company is examining the force of mortality, /x , of a particular group of tyle policyholders. It is thought that it is related to the age, x, of the policyholders by the formula: My = BC* It is decided to analyse this assumption by using the linear regression model: Y =a + B x,+ & where &; ~ M(0,of) are independently distributed The summary results for eight ages were as follows: Age, X 30 32 34 36 38 40 42 44 Force of mortality, Ax 5.84 6.10 6.48 7.05 7.87 9.03 10.56 12.66 ( x10 4) In/x (3 s.f.) - 7.45 - 7.40 - 7.34 - 7.26 - 7.15 - 7.01 - 6.85 - 6.67 [x; =296 _x, =11,120 [Infix, =-57.129 (In/ )? = 408.50 Ex; In/x, =-2,104.5 (i) (a) Apply a transformation to the original formula, /, = Bc*, to make it suitable for analysis by linear regression. Hence, write down expressions for Y, o and / in terms of //x , B and c . (b) Plot a graph of In/ against the age of the policyholder, x. Hence comment on the suitability of the regression model and state how this supports the transformation in part (a). [4] (i) Use the data to calculate least squares estimates of B and c in the original formula. [3] (iii) (a) Calculate the coefficient of determination between In/, and x. Hence comment on the fit of the model to the data. (b) Complete the table of residuals and use it to comment on the fit. [5] Age, X 30 32 34 36 38 40 42 44 Residual, e; 0.08 -0.03 -0.06 0.02 0.09 (iv) Calculate a 95% confidence interval for the mean predicted response In//35 and hence obtain a 95% confidence interval for the mean predicted value of //35- [4] [Total 16]