Answered step by step
Verified Expert Solution
Link Copied!

Question

1 Approved Answer

Solve using MATLAB Experiment 4.4 (a) Create a 3-D line graph with good resolution for a conical helix whose coordinates are defined by following parametric

Solve using MATLAB image text in transcribed
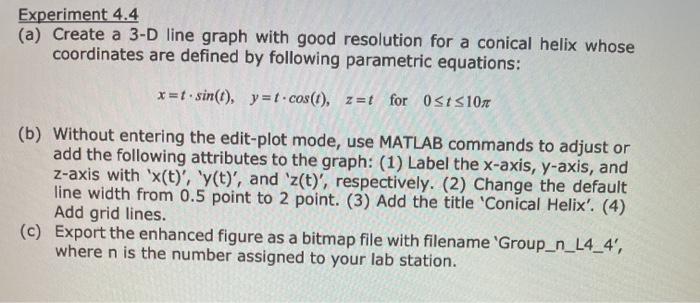
Experiment 4.4 (a) Create a 3-D line graph with good resolution for a conical helix whose coordinates are defined by following parametric equations: * =* sin(t), y=t.cos(t), zrt for 051510x (b) Without entering the edit-plot mode, use MATLAB commands to adjust or add the following attributes to the graph: (1) Label the x-axis, y-axis, and z-axis with 'x(t)', 'y(t)', and 'z(t)', respectively. (2) Change the default line width from 0.5 point to 2 point. (3) Add the title 'Conical Helix'. (4) Add grid lines. (c) Export the enhanced figure as a bitmap file with filename 'Group_n_L4_4', where n is the number assigned to your lab station

Step by Step Solution

There are 3 Steps involved in it

Step: 1

blur-text-image

Get Instant Access to Expert-Tailored Solutions

See step-by-step solutions with expert insights and AI powered tools for academic success

Step: 2

blur-text-image

Step: 3

blur-text-image

Ace Your Homework with AI

Get the answers you need in no time with our AI-driven, step-by-step assistance

Get Started

Recommended Textbook for

Joe Celkos Data And Databases Concepts In Practice

Authors: Joe Celko

1st Edition

1558604324, 978-1558604322

More Books

Students also viewed these Databases questions