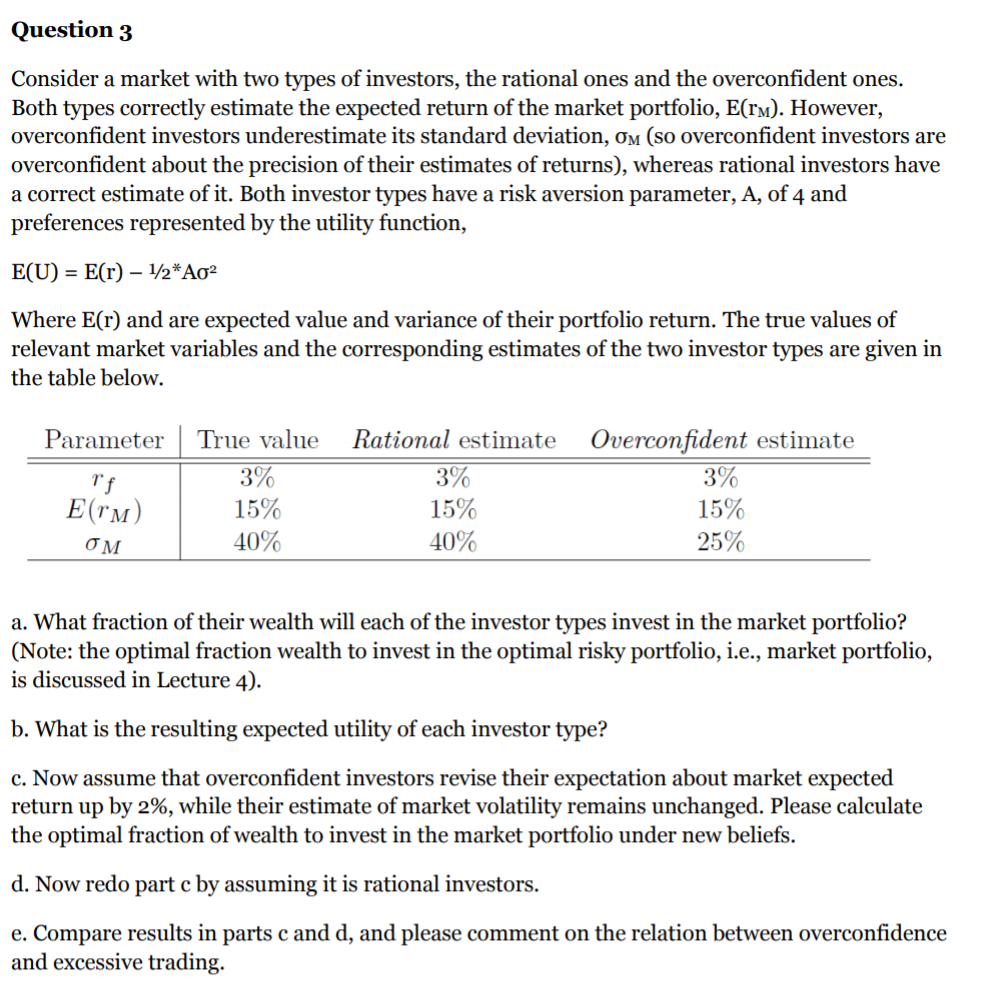
someone commented that standard deviation is needed. question 3 gives it. do not answer question three, that is not needed I am just giving a photo for more info. Please only answer Q4.
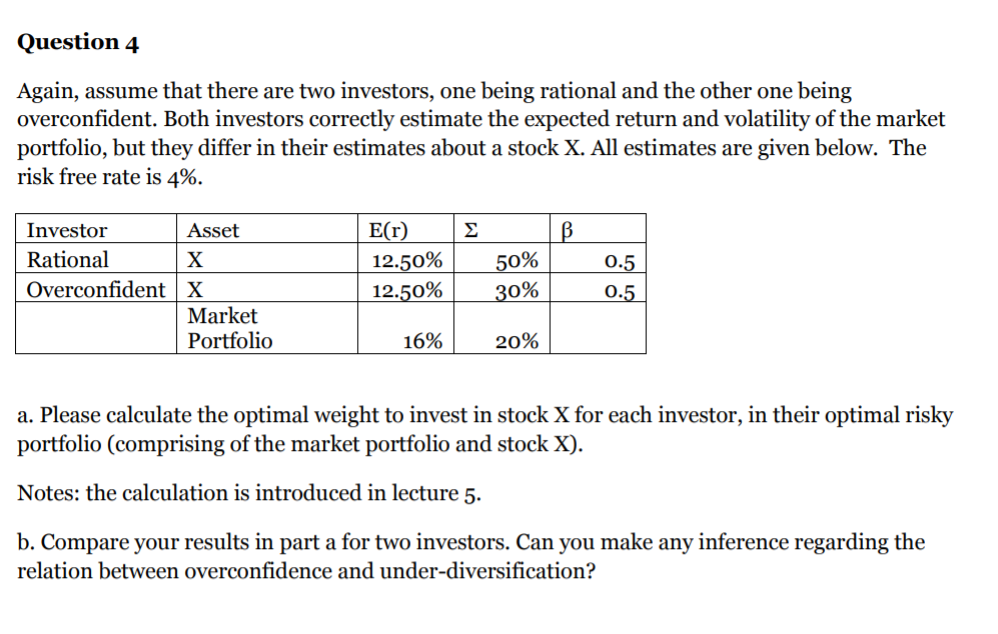
Question 4 Again, assume that there are two investors, one being rational and the other one being th investors correctly estimate the expected return and volatility of the market portfolio, but they differ in their estimates about a stock X. All estimates are given below. The risk free rate is 4%. Investor Asset Rational Overconfident X Market Portfolio E(r) 12.50% 12.50% 50% 30% 0.5 0.5 16% 20% a. Please calculate the optimal weight to invest in stock X for each investor, in their optimal risky portfolio (comprising of the market portfolio and stock X). Notes: the calculation is introduced in lecture 5. b. Compare your results in part a for two investors. Can you make any inference regarding the relation between overconfidence and under-diversification? Question 3 Consider a market with two types of investors, the rational ones and the overconfident ones. Both types correctly estimate the expected return of the market portfolio, E(rm). However, overconfident investors underestimate its standard deviation, om (so overconfident investors are overconfident about the precision of their estimates of returns), whereas rational investors have a correct estimate of it. Both investor types have a risk aversion parameter, A, of 4 and preferences represented by the utility function, E(U) = E(r) - 1/2* Ag2 Where E(r) and are expected value and variance of their portfolio return. The true values of relevant market variables and the corresponding estimates of the two investor types are given in the table below. Parameter | True value Rational estimate 3% 3% rf E(TM) 15% 15% OM 40% 40% Overconfident estimate 3% 15% 25% a. What fraction of their wealth will each of the investor types invest in the market portfolio? (Note: the optimal fraction wealth to invest in the optimal risky portfolio, i.e., market portfolio, is discussed in Lecture 4). b. What is the resulting expected utility of each investor type? c. Now assume that overconfident investors revise their expectation about market expected return up by 2%, while their estimate of market volatility remains unchanged. Please calculate the optimal fraction of wealth to invest in the market portfolio under new beliefs. d. Now redo part c by assuming it is rational investors. e. Compare results in parts c and d, and please comment on the relation between overconfidence and excessive trading. Question 4 Again, assume that there are two investors, one being rational and the other one being th investors correctly estimate the expected return and volatility of the market portfolio, but they differ in their estimates about a stock X. All estimates are given below. The risk free rate is 4%. Investor Asset Rational Overconfident X Market Portfolio E(r) 12.50% 12.50% 50% 30% 0.5 0.5 16% 20% a. Please calculate the optimal weight to invest in stock X for each investor, in their optimal risky portfolio (comprising of the market portfolio and stock X). Notes: the calculation is introduced in lecture 5. b. Compare your results in part a for two investors. Can you make any inference regarding the relation between overconfidence and under-diversification? Question 3 Consider a market with two types of investors, the rational ones and the overconfident ones. Both types correctly estimate the expected return of the market portfolio, E(rm). However, overconfident investors underestimate its standard deviation, om (so overconfident investors are overconfident about the precision of their estimates of returns), whereas rational investors have a correct estimate of it. Both investor types have a risk aversion parameter, A, of 4 and preferences represented by the utility function, E(U) = E(r) - 1/2* Ag2 Where E(r) and are expected value and variance of their portfolio return. The true values of relevant market variables and the corresponding estimates of the two investor types are given in the table below. Parameter | True value Rational estimate 3% 3% rf E(TM) 15% 15% OM 40% 40% Overconfident estimate 3% 15% 25% a. What fraction of their wealth will each of the investor types invest in the market portfolio? (Note: the optimal fraction wealth to invest in the optimal risky portfolio, i.e., market portfolio, is discussed in Lecture 4). b. What is the resulting expected utility of each investor type? c. Now assume that overconfident investors revise their expectation about market expected return up by 2%, while their estimate of market volatility remains unchanged. Please calculate the optimal fraction of wealth to invest in the market portfolio under new beliefs. d. Now redo part c by assuming it is rational investors. e. Compare results in parts c and d, and please comment on the relation between overconfidence and excessive trading


