Answered step by step
Verified Expert Solution
Question
1 Approved Answer
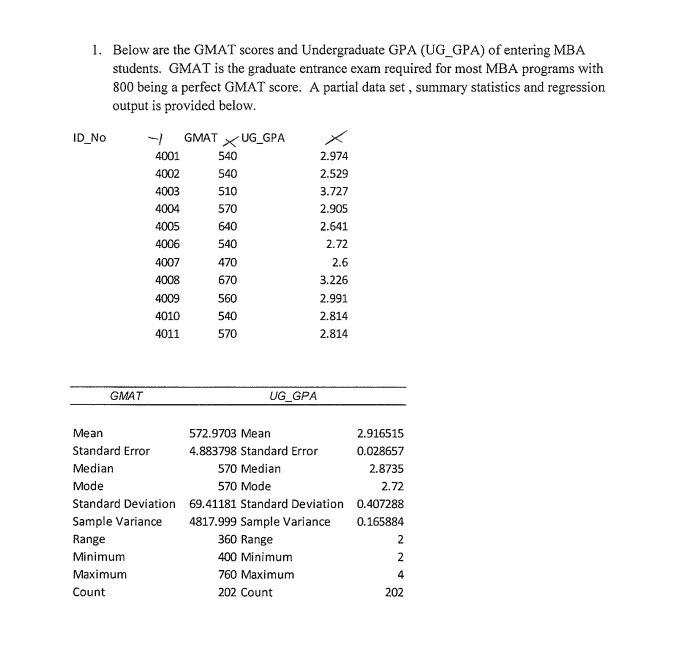
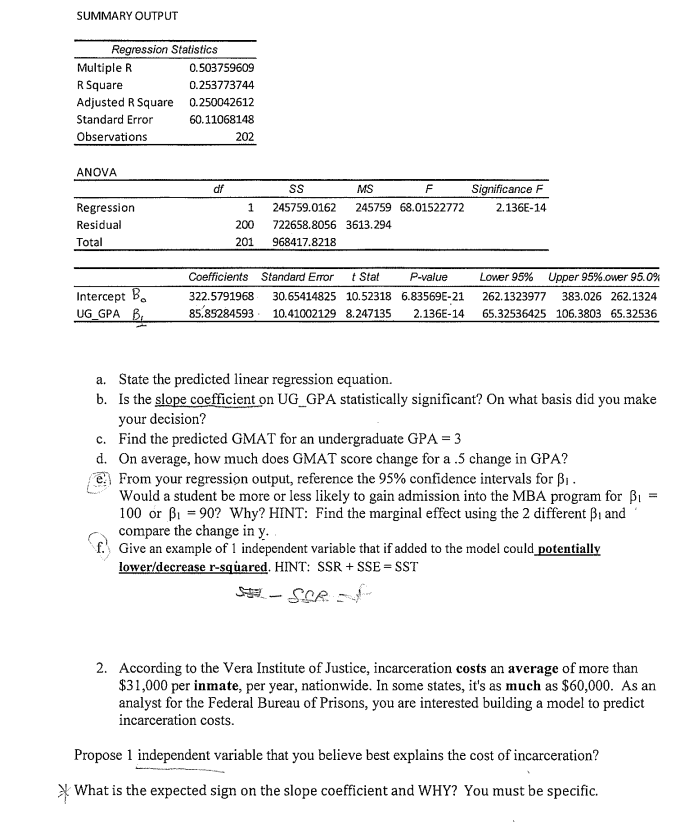
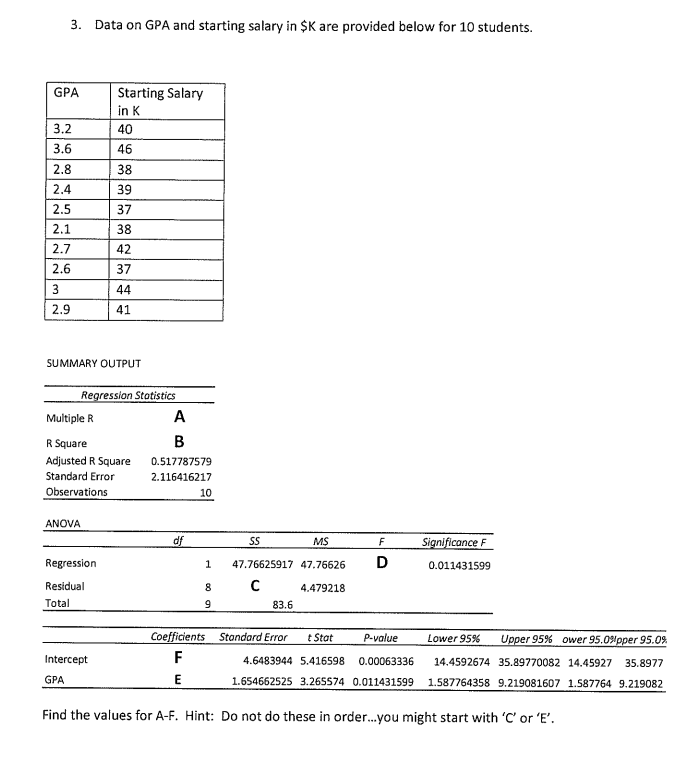
Someone help me to solve it. If you don't mind please explain it to me cause I need to prepare for the exam next week.
\fSUMMARY OUTPUT Regression Statistic Multiple R 0.503759609 R Square 0.253773744 Adjusted R Square 0.250042612 Standard Error 60.11068148 Observation 202 ANOVA df SS MS F Significance F Regression 1 245759.0162 245759 68.01522772 2.136E-14 Residual 200 722658.8056 3613.294 Total 201 968417.8218 Coefficients Standard Error t Stat -value Lower 95% Upper 95% ower 95.0% Intercept be 322.5791968 30.65414825 10.52318 6.83569E-21 262.1323977 383.026 262.1324 UG_GPA B 85.85284593 . 10.41002129 8.247135 2.136E-14 65.32536425 106.3803 65.32536 a. State the predicted linear regression equation. b. Is the slope coefficient on UG_GPA statistically significant? On what basis did you make your decision? c. Find the predicted GMAT for an undergraduate GPA = 3 d. On average, how much does GMAT score change for a .5 change in GPA? el From your regression output, reference the 95% confidence intervals for Bi . Would a student be more or less likely to gain admission into the MBA program for BI = 100 or B1 = 90? Why? HINT: Find the marginal effect using the 2 different Bi and compare the change in y. f. Give an example of 1 independent variable that if added to the model could potentially lower/decrease r-squared. HINT: SSR + SSE = SST 2. According to the Vera Institute of Justice, incarceration costs an average of more than $31,000 per inmate, per year, nationwide. In some states, it's as much as $60,000. As an analyst for the Federal Bureau of Prisons, you are interested building a model to predict incarceration costs. Propose 1 independent variable that you believe best explains the cost of incarceration? What is the expected sign on the slope coefficient and WHY? You must be specific.3. Data on GPA and starting salary in $K are provided below for 10 students. GPA Starting Salary in K 3.2 40 3.6 46 2.8 38 2.4 39 2.5 37 2.1 38 2.7 42 2.6 37 3 44 2.9 41 SUMMARY OUTPUT Regression Statistics Multiple R A R Square B Adjusted R Square 0.517787579 Standard Error 2.116416217 Observations 10 ANOVA of 55 VS F Significance F Regression 1 47.76625917 47.76626 D 0.011431599 Residual C 4.479218 Total 83.6 Coefficients Standard Error t Stat P-value Lower 95% Upper 95% ower 95.01/pper 95.0% Intercept T 4.6483944 5.416598 0.00063336 14,4592674 35.89770082 14.45927 35.8977 m GPA 1.654662525 3.265574 0.011431599 1.587764358 9.219081607 1.587764 9.219082 Find the values for A-F. Hint: Do not do these in order.. you might start with 'C' or 'EStep by Step Solution
There are 3 Steps involved in it
Step: 1
Get Instant Access to Expert-Tailored Solutions
See step-by-step solutions with expert insights and AI powered tools for academic success
Step: 2
Step: 3
Ace Your Homework with AI
Get the answers you need in no time with our AI-driven, step-by-step assistance
Get Started