Someone please help me! just4 questions. **THIS QUESTION IS COMPLETE, there's no other information I can provide all of it is on the bottom**
I included my previous work in the bottom just in case you may need it to help you solve the problems! Thank you so much and please please help me
- Describe the sample statistic in words. What is the distribution of the sample statistic? Explain why it has this distribution.
- Use your graphing calculator to calculate the test statistic & p-value. State which calculator command you used and explain why.
- Sketch a graph of the region whose area the p-value represents. Label the values of the horizontal axis with the appropriate values.
- Define the p-value in the context of the problem.
Previous work to help solve:
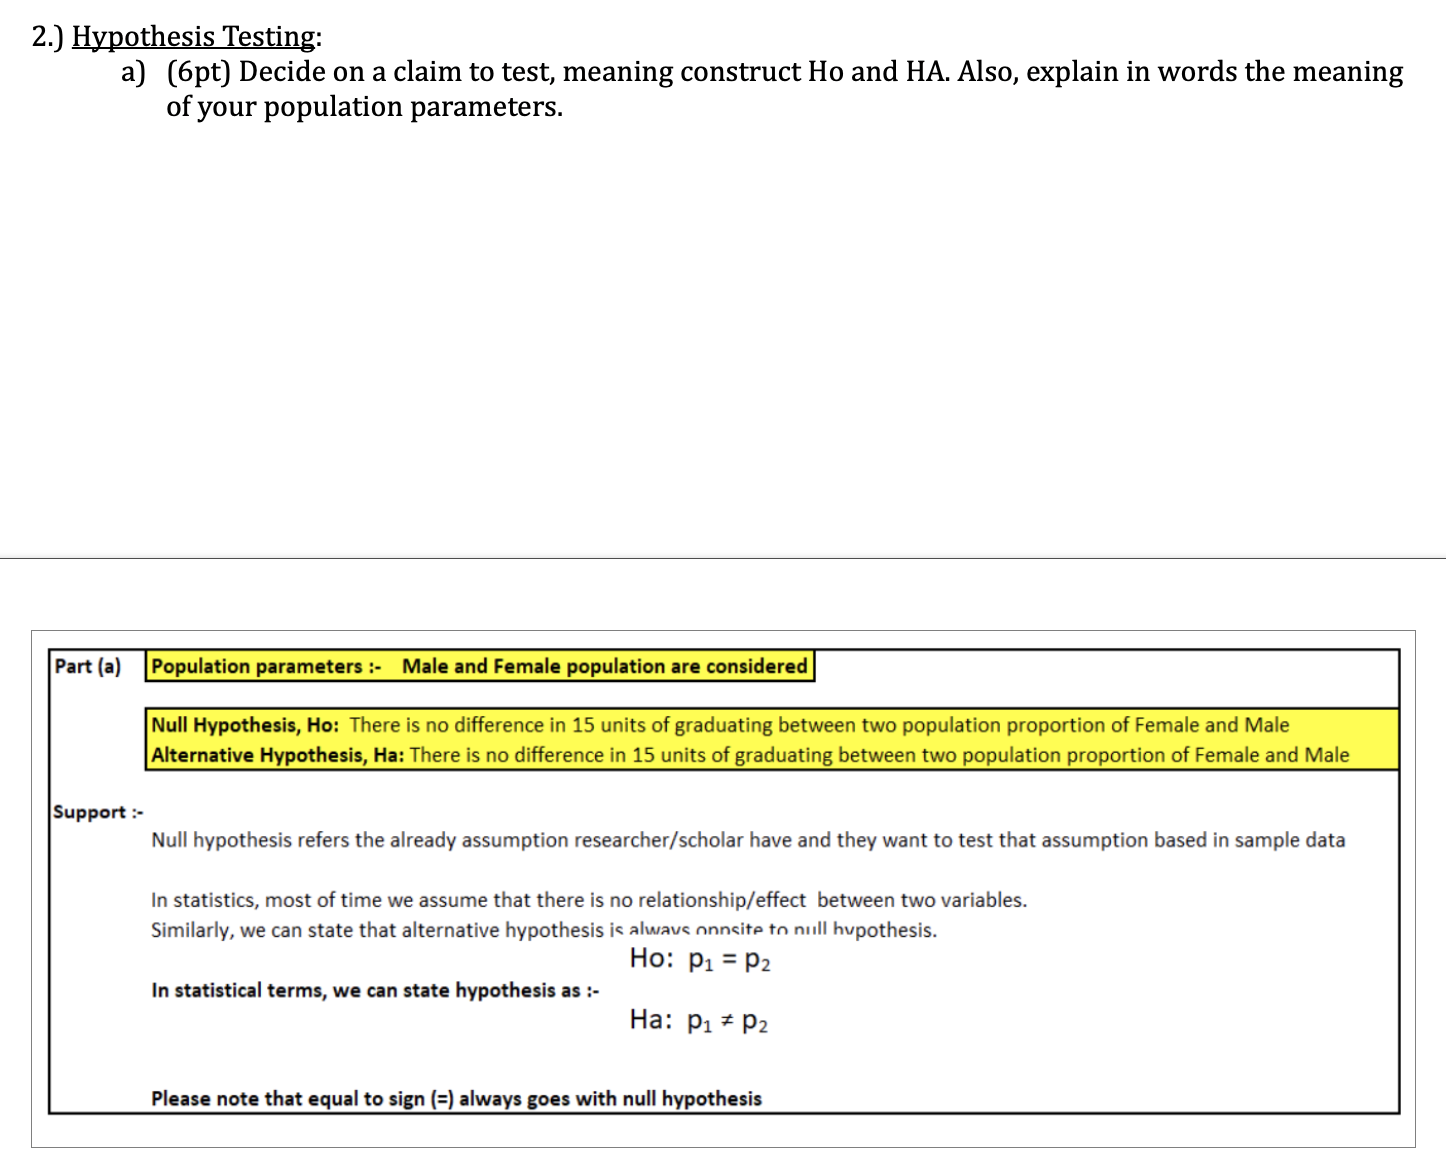
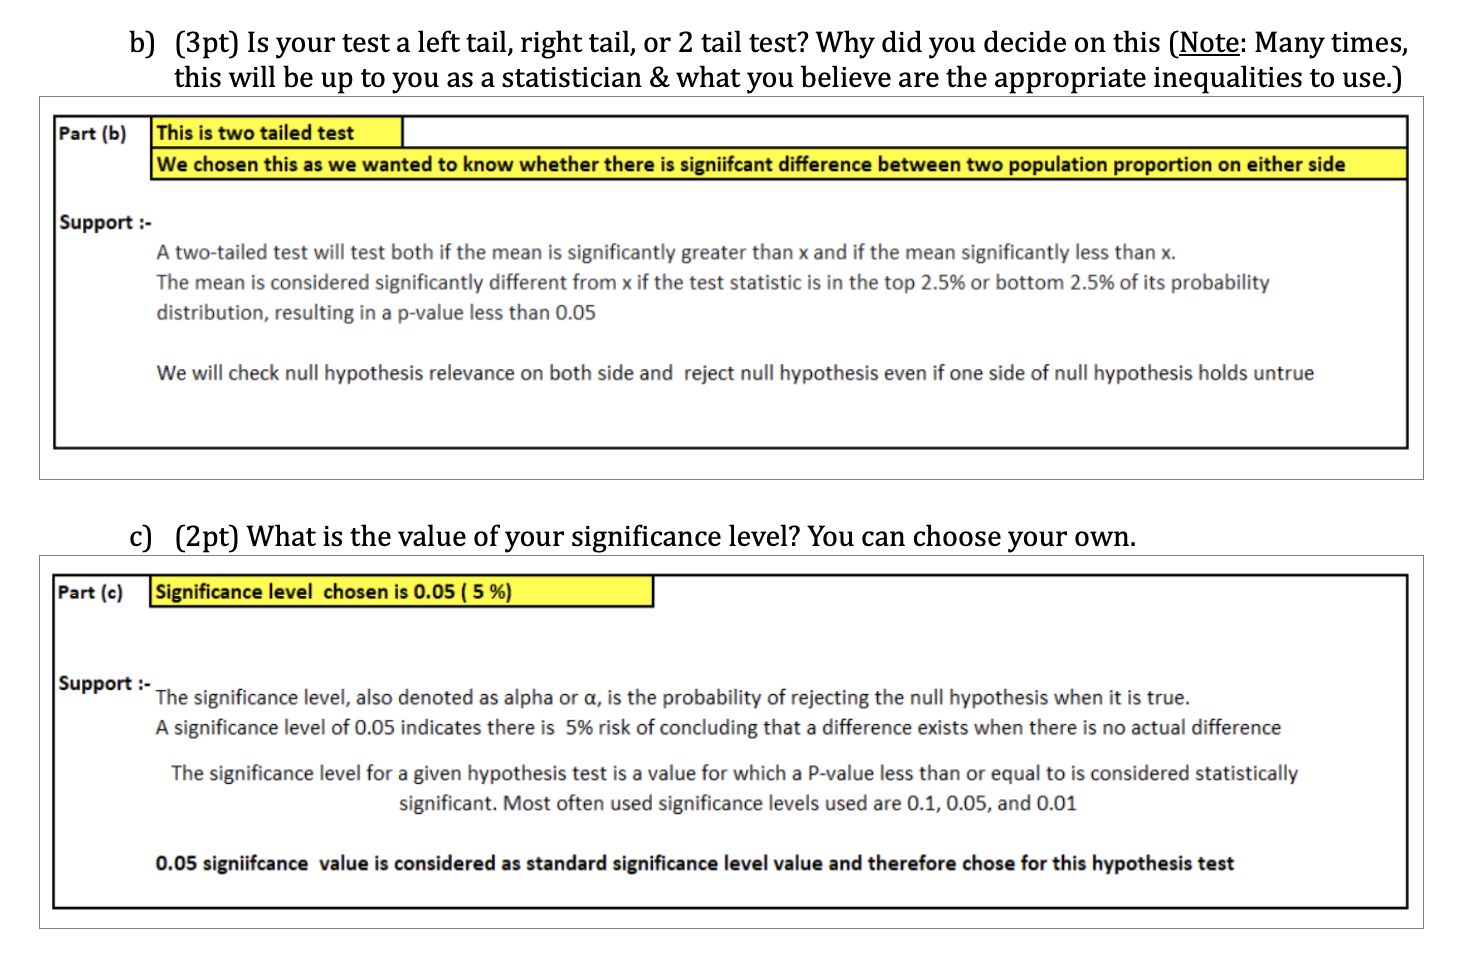
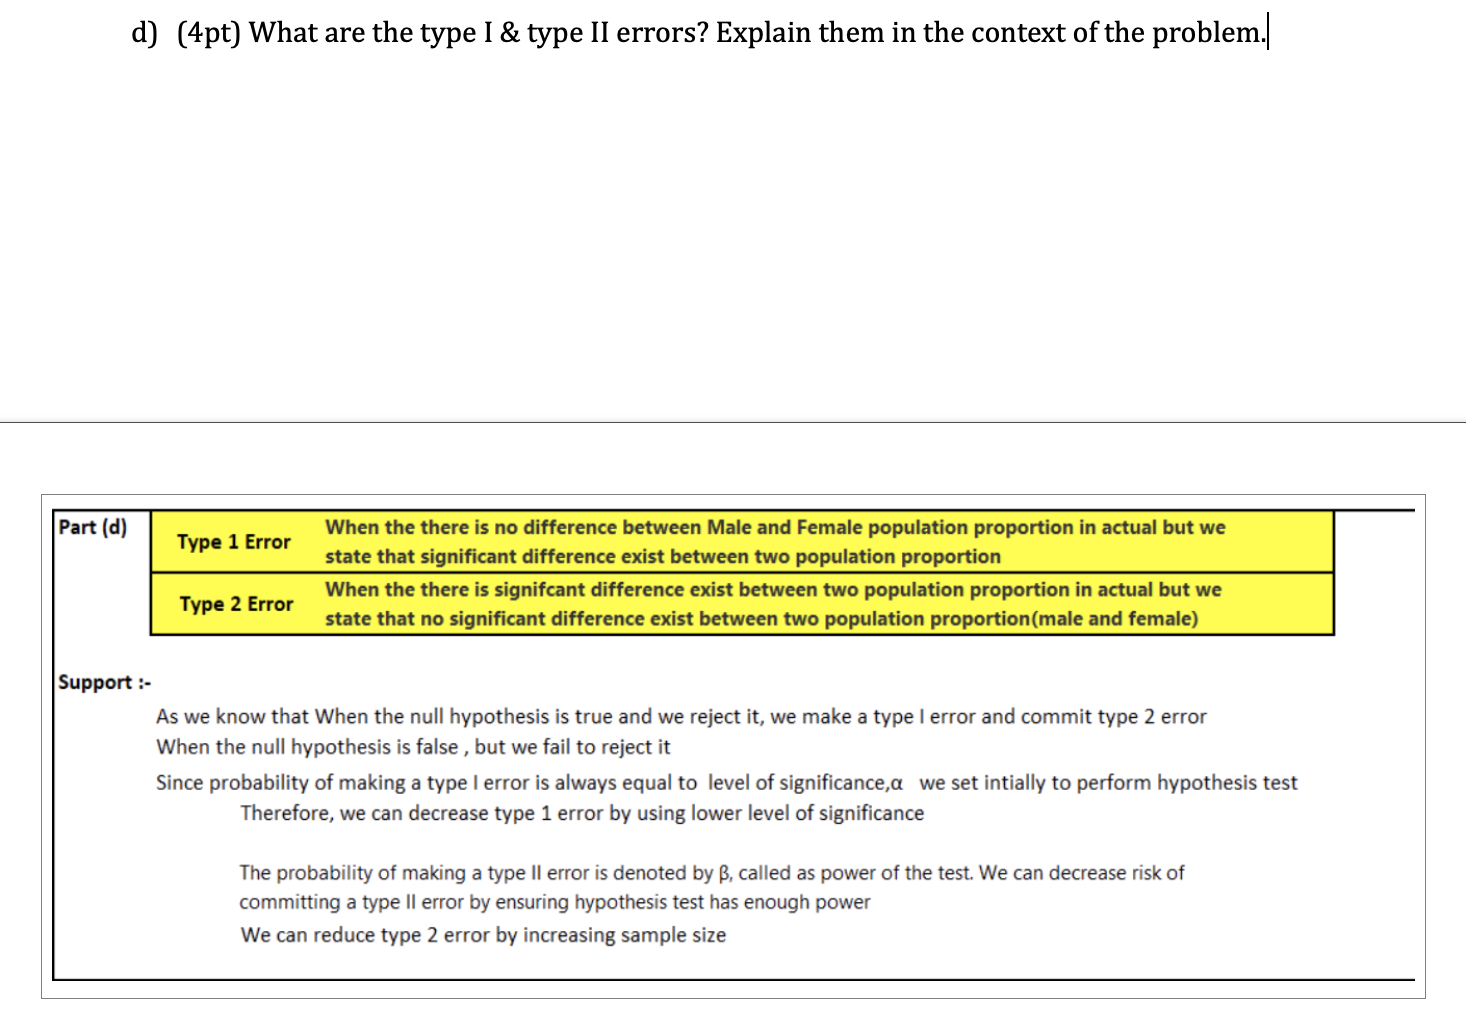
Part III: Two-Population. Proportion Question (45 total pigs) 1) Question: 3) (lpt) What is the question you asked the student? Are you within 15 units of graduating? 2.) Hypothesis Testing: a) (6pt) Decide on a claim to test, meaning construct Ho and HA. Also, explain in words the meaning of your population parameters. Part (a) Population parameters :- Male and Female population are considered Null Hypothesis, Ho: There is no difference in 15 units of graduating between two population proportion of Female and Male Alternative Hypothesis, Ha: There is no difference in 15 units of graduating between two population proportion of Female and Male Support :- Null hypothesis refers the already assumption researcher/scholar have and they want to test that assumption based in sample data In statistics, most of time we assume that there is no relationship/effect between two variables. Similarly, we can state that alternative hypothesis is always onnsite to null hypothesis. Ho: P1 = P2 In statistical terms, we can state hypothesis as :- Ha: P1 * P2 Please note that equal to sign (=) always goes with null hypothesisb) (3pt) Is your test a left tail, right tail, or 2 tail test? Why did you decide on this (Note: Many times, this will be up to you as a statistician & what you believe are the appropriate inequalities to use.) Part (b) This is two tailed test We chosen this as we wanted to know whether there is signiifcant difference between two population proportion on either side Support :- A two-tailed test will test both if the mean is significantly greater than x and if the mean significantly less than x. The mean is considered significantly different from x if the test statistic is in the top 2.5% or bottom 2.5% of its probability distribution, resulting in a p-value less than 0.05 We will check null hypothesis relevance on both side and reject null hypothesis even if one side of null hypothesis holds untrue c) (2pt) What is the value of your significance level? You can choose your own. Part (c) Significance level chosen is 0.05 ( 5 %) Support :- The significance level, also denoted as alpha or a, is the probability of rejecting the null hypothesis when it is true. A significance level of 0.05 indicates there is 5% risk of concluding that a difference exists when there is no actual difference The significance level for a given hypothesis test is a value for which a P-value less than or equal to is considered statistically significant. Most often used significance levels used are 0.1, 0.05, and 0.01 0.05 signiifcance value is considered as standard significance level value and therefore chose for this hypothesis testd) (4pt) What are the type I & type II errors? Explain them in the context of the problem. Part (d) Type 1 Error When the there is no difference between Male and Female population proportion in actual but we state that significant difference exist between two population proportion Type 2 Error When the there is signifcant difference exist between two population proportion in actual but we state that no significant difference exist between two population proportion (male and female) Support :- As we know that When the null hypothesis is true and we reject it, we make a type I error and commit type 2 error When the null hypothesis is false , but we fail to reject it Since probability of making a type I error is always equal to level of significance,a we set intially to perform hypothesis test Therefore, we can decrease type 1 error by using lower level of significance The probability of making a type II error is denoted by , called as power of the test. We can decrease risk of committing a type ll error by ensuring hypothesis test has enough power We can reduce type 2 error by increasing sample size