Answered step by step
Verified Expert Solution
Link Copied!

Question

1 Approved Answer

Someone please help me make this code work on matlab. All i am trying to do is make a histogram with the Max y value

Someone please help me make this code work on matlab. All i am trying to do is make a histogram with the Max y value of 4 for this image. image text in transcribed
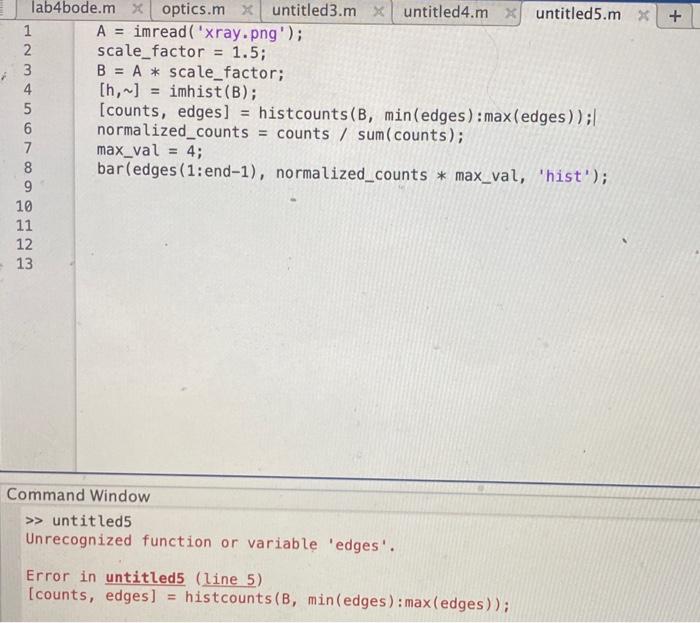
\( \begin{array}{ll}l \\ 1 & \text { lab4bode.m } \times \text { optics.m } \times \text { untitled3.m } \times \text { untitled4.m } \times \text { untitled5.m } \\ 2 & \text { scale_factor }=1.5 ; \\ 3 & \text { B }=A * \text { scale_factor; } \\ 4 & {[h, \sim]=\text { imhist }(B) ;} \\ 5 & [\text { counts, edges] }=\text { histcounts }(B, \text { min(edges) }) \text { max(edges })) ; \\ 6 & \text { normalized_counts }=\text { counts / sum(counts); } \\ 7 & \text { max_val }=4 ; \\ 8 & \text { bar(edges }(1 ; \text { ind-1), normalized_counts * max_val, 'hist' }) ; \\ 9 & \end{array} \)

Step by Step Solution

There are 3 Steps involved in it

Step: 1

blur-text-image

Get Instant Access to Expert-Tailored Solutions

See step-by-step solutions with expert insights and AI powered tools for academic success

Step: 2

blur-text-image

Step: 3

blur-text-image

Ace Your Homework with AI

Get the answers you need in no time with our AI-driven, step-by-step assistance

Get Started

Students also viewed these Databases questions

Question

2. What process will you put in place to address conflicts?

Answered: 1 week ago