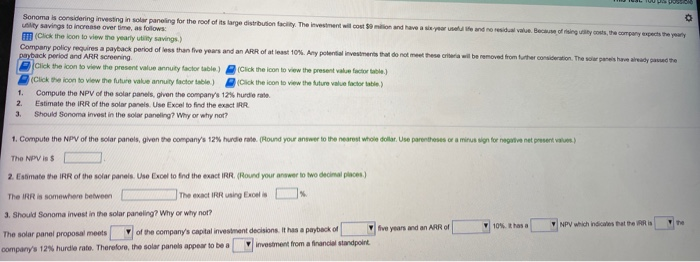
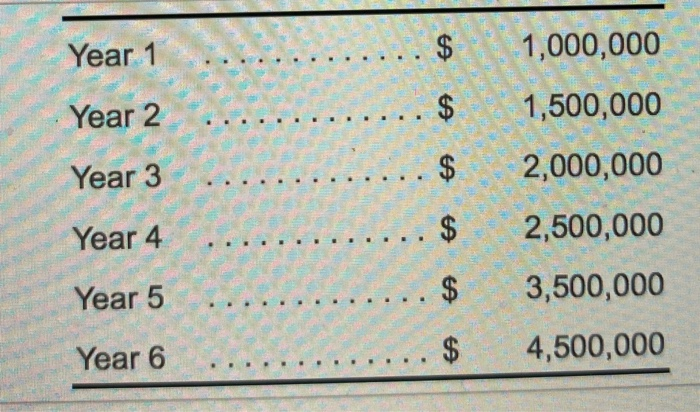
Sonoma is considering investing in solar paneling for the roof of its large distribution facility. The investment will cost so non and have a separate and no residual value. Because of singly costs, the company expects the yearly utility savings to increase over time, as follows: (Click the icon to view the yearly tilty savings) Company policy requires a payback period of less than five years and an ARR of at least 10%. Any potential investments that do not meet these criteria will be removed from further consideration. The solar panels here ready puede payback period and ARR screening Blick the icon to view the present value annuity factor table) (Click the icon to view the present value factore) (Click the icon to view the future value annuity factor table) Click the icon to view the future value factor table) 1. Compute the NPV of the solar panels, given the company's 12% hurdle rato 2. Estimate the IRR of the solar panels. Use Excel to find the exact RR Should Sonoma invest in the solar paneling? Why or why not? 3. 1. Computo the NPV of the solar panels, given the companys 12%. hurdo rato. (Round your answer to the nearest whole dollar. Use parentheses ce au minus sign for negative net procent value) The NPV is $ 2. Estimate the IRR of the solar panels. Une Excel to find the exact IRR, (Round your answer to two decimal places) The IRR is somewhere between | The exact Rush Brol 3. Should Sonoma invest in the solar paneling? Why or why not? The solar panel proposal meets of the company's capital investment decisions. It has a payback of five years and an ARRO 10% has a NPV which indicates the pris company's 12% hurdle rate. Therefore, the solar panels appear to be a investment from a financial standpoint Te Year 1 $ 1,000,000 Year 2 $ 1,500,000 Year 3 $ 2,000,000 Year 4 $ 2,500,000 Year 5 . $ 3,500,000 Year 6 $ 4,500,000 . 2. Present Value of Annuity of $1 Periods 1% 2% 3% 4% 5% 6% 8% 10% 12% 0.990 0.980 0.971 0.962 0.952 0.943 0.926 0.909 0.893 1.970 1.942 1.913 1.886 1.859 1.833 1.783 1.736 1.690 3 2.941 2.884 2.829 2.775 2.723 2.673 2.577 2.487 2.402 4 3.902 3.808 3.717 3.630 3.546 3.465 3.312 3.170 3.037 5 4.853 4.713 4.580 4.452 4.329 4.212 3.993 3.791 3.605 6 5.795 5.601 5.417 5.242 5.076 4.917 4.623 4.355 4.111 7 6.728 6.472 6.230 6.002 5.786 5.582 5.206 4.868 4.564 8 7.652 7.325 7.020 6.733 6.463 6.210 5.747 5.335 4.968 9 8.566 8.162 7.786 7.435 7.108 6.802 6.247 5.759 5.328 10 9.471 8.983 8.530 8.111 7.722 7.360 6.710 6.145 5.650 11 10.368 9.787 9.253 8.760 8.306 7.887 7.139 6.495 5.938 12 11.255 10.575 9.954 9.385 8.863 8.384 7.536 6.814 6.194 13 12.134 11.348 10.635 9.986 9.394 8.853 7.904 6.424 14 13.004 12.106 11.296 10.563 9.899 9.295 8.244 7.367 6.628 15 13.865 12.849 11.938 11.118 10.380 9.712 8.559 7.606 6.811 20 18.046 16.351 14.877 13.590 12.462 11.470 9.818 8.514 7.469 25 22.023 19.523 17.413 15.622 14.094 12.783 10.675 9.077 7.843 30 25.808 22.396 19.600 17.292 15.372 13.765 11.2589.427 8.055 40 32.835 27.355 23.115 19.793 17.159 15.046 11.925 9.779 8.244 14% 16% 18% 20% 0.877 0.862 0.847 0.833 1.647 1.605 1.566 1.528 2.322 2.246 2.174 2.106 2.914 2.798 2.690 2.589 3.433 3.274 3.127 2.991 3.889 3.685 3.498 3.326 4.288 4.039 3.812 3.605 4.639 4.344 4.078 3.837 4.946 4.607 4.303 4.031 5.216 4.833 4.494 4.192 5.453 5.029 4.656 4.327 5.660 5.1974.793 4.439 5.842 5.342 4.910 4.533 6.0025.468 5.008 4.611 6.142 5.575 5.092 4.675 6.623 5.929 5.353 4.870 6.873 6.097 5.467 4.948 7.003 6.177 5.517 4.979 7.105 6.233 5.548 4.997 7.103 ar Periods 10 1.000 2010 3. 020 2.100 No 2 1.000 200 3060 4122 5 200 1000 2.030 13.091 4.194 5.309 1000 2.CMD 3122 4.24 5416 8 1.000 2.060 3.153 4.310 5.526 Future Value of Annuity of $1 6 6% 10% 1.DUO 1.000 1.ooo 2.00 2.060 3.194 3.246 3.310 4.375 4.506 4.64] 5.637 5 867 6. 105 6975 7336 7.716 B394 823 9.467 999] 1037 1.438 11.491 12 488 13.579 13.181 14497 15.937 12 1.000 2.120 3374 4.79 6353 OEO 5 5.101 in Teen 6.308 7.434 .583 9.755 10.950 6.466 7682 8. 892 10.159 11.464 6.633 7 886 19.214 0.583 12.006 6.92 9.142 9.549 1.027 12.576 3.115 10.099 12.300 14.76 17.549 149 16% 16 20% 1000 1000 1.C00 1.000 2.140 2160 2.180 2.200 13.440 3.506 3.572 3. EAD 4.92] 5066 5215 5.256 6.610 6. 7.154 7.442 6.536 8.97 9442 9990 10.730 11.474 12.142 12916 1323 14.240 15.327 1649 16.085 17.519 19.066 20.79 19.337 21.321 23.521 25.959 23.045 25.733 28.755 32.150 27.27] 30.850 34.931 33.581 32.069 36.786 42.219 48.497 37.58] 43.672 0.818 59.196 | 43 842 51.660 0.965 2.035 91.25 115.380 146.628 186688 161.874 249.214 342 B03 471981 356.787 530312 790 946 1.161.682 1.342.025 2.360.757] 4.163.213 7.343.858 6.152 7214 0285 9369 10.462 1.567 12663 13.00 14.47 16.097 22.019 243 34.75 48.896 11 12 13 14 15 12.169 13.412 14.680 15.974 17.297 24 297 32.000 40.56 60.402 12. BOB 14.192 15.618 17.046 16.599 13.466 15.026 16.627 13.292 20.024 14.207 15.917 17.713 19.599 21.57 14.972 16.870 16.882 21.015 23.275 16.45 16.977 21.495 24.215 27.152 45.762 73.10 113 283 259.057 10.53] 21.384 24.525 27.975 31. TT2 20.65 24.133 28.029 32.393 37 260 20 25 30 40 25.470 36.459 47.575 75.401 29.7 41.646 56.065 95.026 33.066 47.7 6.439 120.800 36.786 54.965 79.058 154.762 57.275 98.347 164.44 442 563 72.052 133.334 241.333 767.091 ins 1 0.855 5 Periods 1% 2% 3% 4% 5% 0.990 0.980 0.971 0.962 0.952 2 0.980 0.961 0.943 0.925 0.907 3 0.971 0.942 0.915 0.889 0.864 4 0.961 0.924 0.888 0.823 0.951 0.906 0.863 0.822 0.784 6 0.942 0.888 0.837 0.790 0.746 0.933 0.871 0.813 0.760 0.711 0.923 0.853 0.789 0.731 0.677 0.914 0.837 0.766 0.703 0.645 0.905 0.820 0.744 0.676 0.614 11 0.896 0.804 0.722 0.650 12 0.887 0.788 0.701 0.625 0.557 13 0.879 0.773 0.681 0.601 0.530 14 0.870 0.758 0.661 0.577 0.505 15 0.861 0.743 0.642 0.555 0.481 20 0.820 0.673 0.554 0.456 0.377 25 0.780 0.610 0.478 0.375 0.295 30 0.742 0.552 0.412 0.308 0.231 40 0.672 0.453 0.307 0.208 0.142 8 9 10 Present Value of $1 6% 8% 10% 12% 14% 16% 18% 20% 0.943 0.926 0.909 0.893 0.877 0.862 0.847 0.833 0.890 0.857 0.826 0.797 0.769 0.743 0.718 0.694 0.840 0.794 0.751 0.712 0.675 0.641 0.609 0.579 0.792 0.735 0.683 0.636 0.592 0.552 0.516 0.482 0.747 0.681 0.621 0.567 0.519 0.476 0.437 0.402 0.705 0.630 0.564 0.507 0.456 0.410 0.370 0.335 0.665 0.583 0.513 0.452 0.400 0.354 0.314 0.279 0.627 0.540 0.467 0.404 0.351 0.305 0.266 0.233 0.592 0.500 0.424 0.361 0.308 0.263 0.225 0.194 0.558 0.463 0.386 0.322 0.270 0.227 0.191 0.162 0.527 0.429 0.350 0.287 0.237 0.195 0.162 0.135 0.497 0.397 0.319 0.257 0.208 0.168 0.137 0.112 0.469 0.368 0.290 0.229 0.182 0.145 0.116 0.093 0.442 0.340 0.263 0.205 0.160 0.125 0.099 0.078 0.417 0.315 0.239 0.183 0.140 0.108 0.084 0.065 0.312 0.215 0.149 0.104 0.073 0.051 0.037 0.026 0.233 0.146 0.092 0.059 0.038 0.024 0.016 0.010 0.174 0.099 0.057 0.033 0.0200.012 0.007 0.004 0.097 0.046 0.022 0.011 0.005 0.003 0.001 0.001 0.585 Future Value of $1 Periods 1 2 3 4 5 1% 1,010 1.020 1.030 1.041 1.051 2% 1.020 1.040 1.061 1.082 1.104 3% 1.030 1.061 1.093 1.126 1.159 4% 1.040 1.082 1.125 1.170 1.217 6% 1.060 1.124 1.191 1.262 1.338 5% 1.050 1.103 1.158 1.216 1.276 1.340 1.407 1.477 1.551 1.629 14% 1.140 1.300 1.482 1.689 1.925 20% 1.200 1.440 1.728 2.074 2.488 8% 1.080 1.166 1.260 1.360 1.469 1,587 1.714 1.851 1.999 2.159 18% 1.180 1.392 1.643 1.939 2.288 12% 1.120 1.254 1.405 1.574 1.762 1.974 2.211 2.476 2.773 3.106 16% 1.160 1.346 1.561 1.811 2.100 2.436 2.826 3.278 3.803 4411 6 7 1.062 1.072 1.083 1.094 1.105 1.126 1.149 1.172 1.195 1.219 1.194 1.230 1.267 1.305 1.344 10% 1.100 1.210 1.331 1.464 1.611 1.772 1.949 2.144 2.358 2.594 2.853 3.138 3.452 3.797 4.177 1.419 1.504 1.594 1.689 1.791 2.195 2.502 2.853 3.252 3.707 2.700 3.185 3.759 4.435 5.234 2.986 3.583 4.300 5.160 6.192 9 10 11 12 13 14 15 1.116 1.127 1.138 1.149 1.161 1.243 1.268 1.294 1.319 1.346 1.265 1.316 1.369 1.423 1.480 1.539 1.601 1.665 1.732 1.801 2.191 2.666 3.243 4.801 1.384 1.426 1.469 1513 1.558 1.710 1.796 1.886 1.980 2.079 1.898 2.012 2.133 2.261 2.397 2.332 2.518 2.720 2.937 3.172 3,479 3.896 4.363 4.887 5.474 5.117 5.536 6.886 7.988 9.286 4.226 4.818 5.492 6.261 7.138 13.743 26.482 50.950 188.884 6.176 7.288 8.599 10.147 11.974 7.430 8.916 10.899 12.839 15.407 20 25 30 40 1.220 1.282 1.348 1.489 1.486 1.641 1.811 2.208 1.806 2.094 2.427 3.262 2.653 3.386 4.322 7.040 3.207 4.292 5.743 10.286 4.661 6.848 10.063 21.725 6.727 10.835 17.449 45.259 9.646 17.000 29.960 93.051 19.461 40.874 85.850 378.721 27.393 62.669 143.371 750.378 38.338 95.396 237.376 1,469.772