Sorry for the unorganized pictures. I have difficulty of figuring out how to solve this problem? I need help thanks!
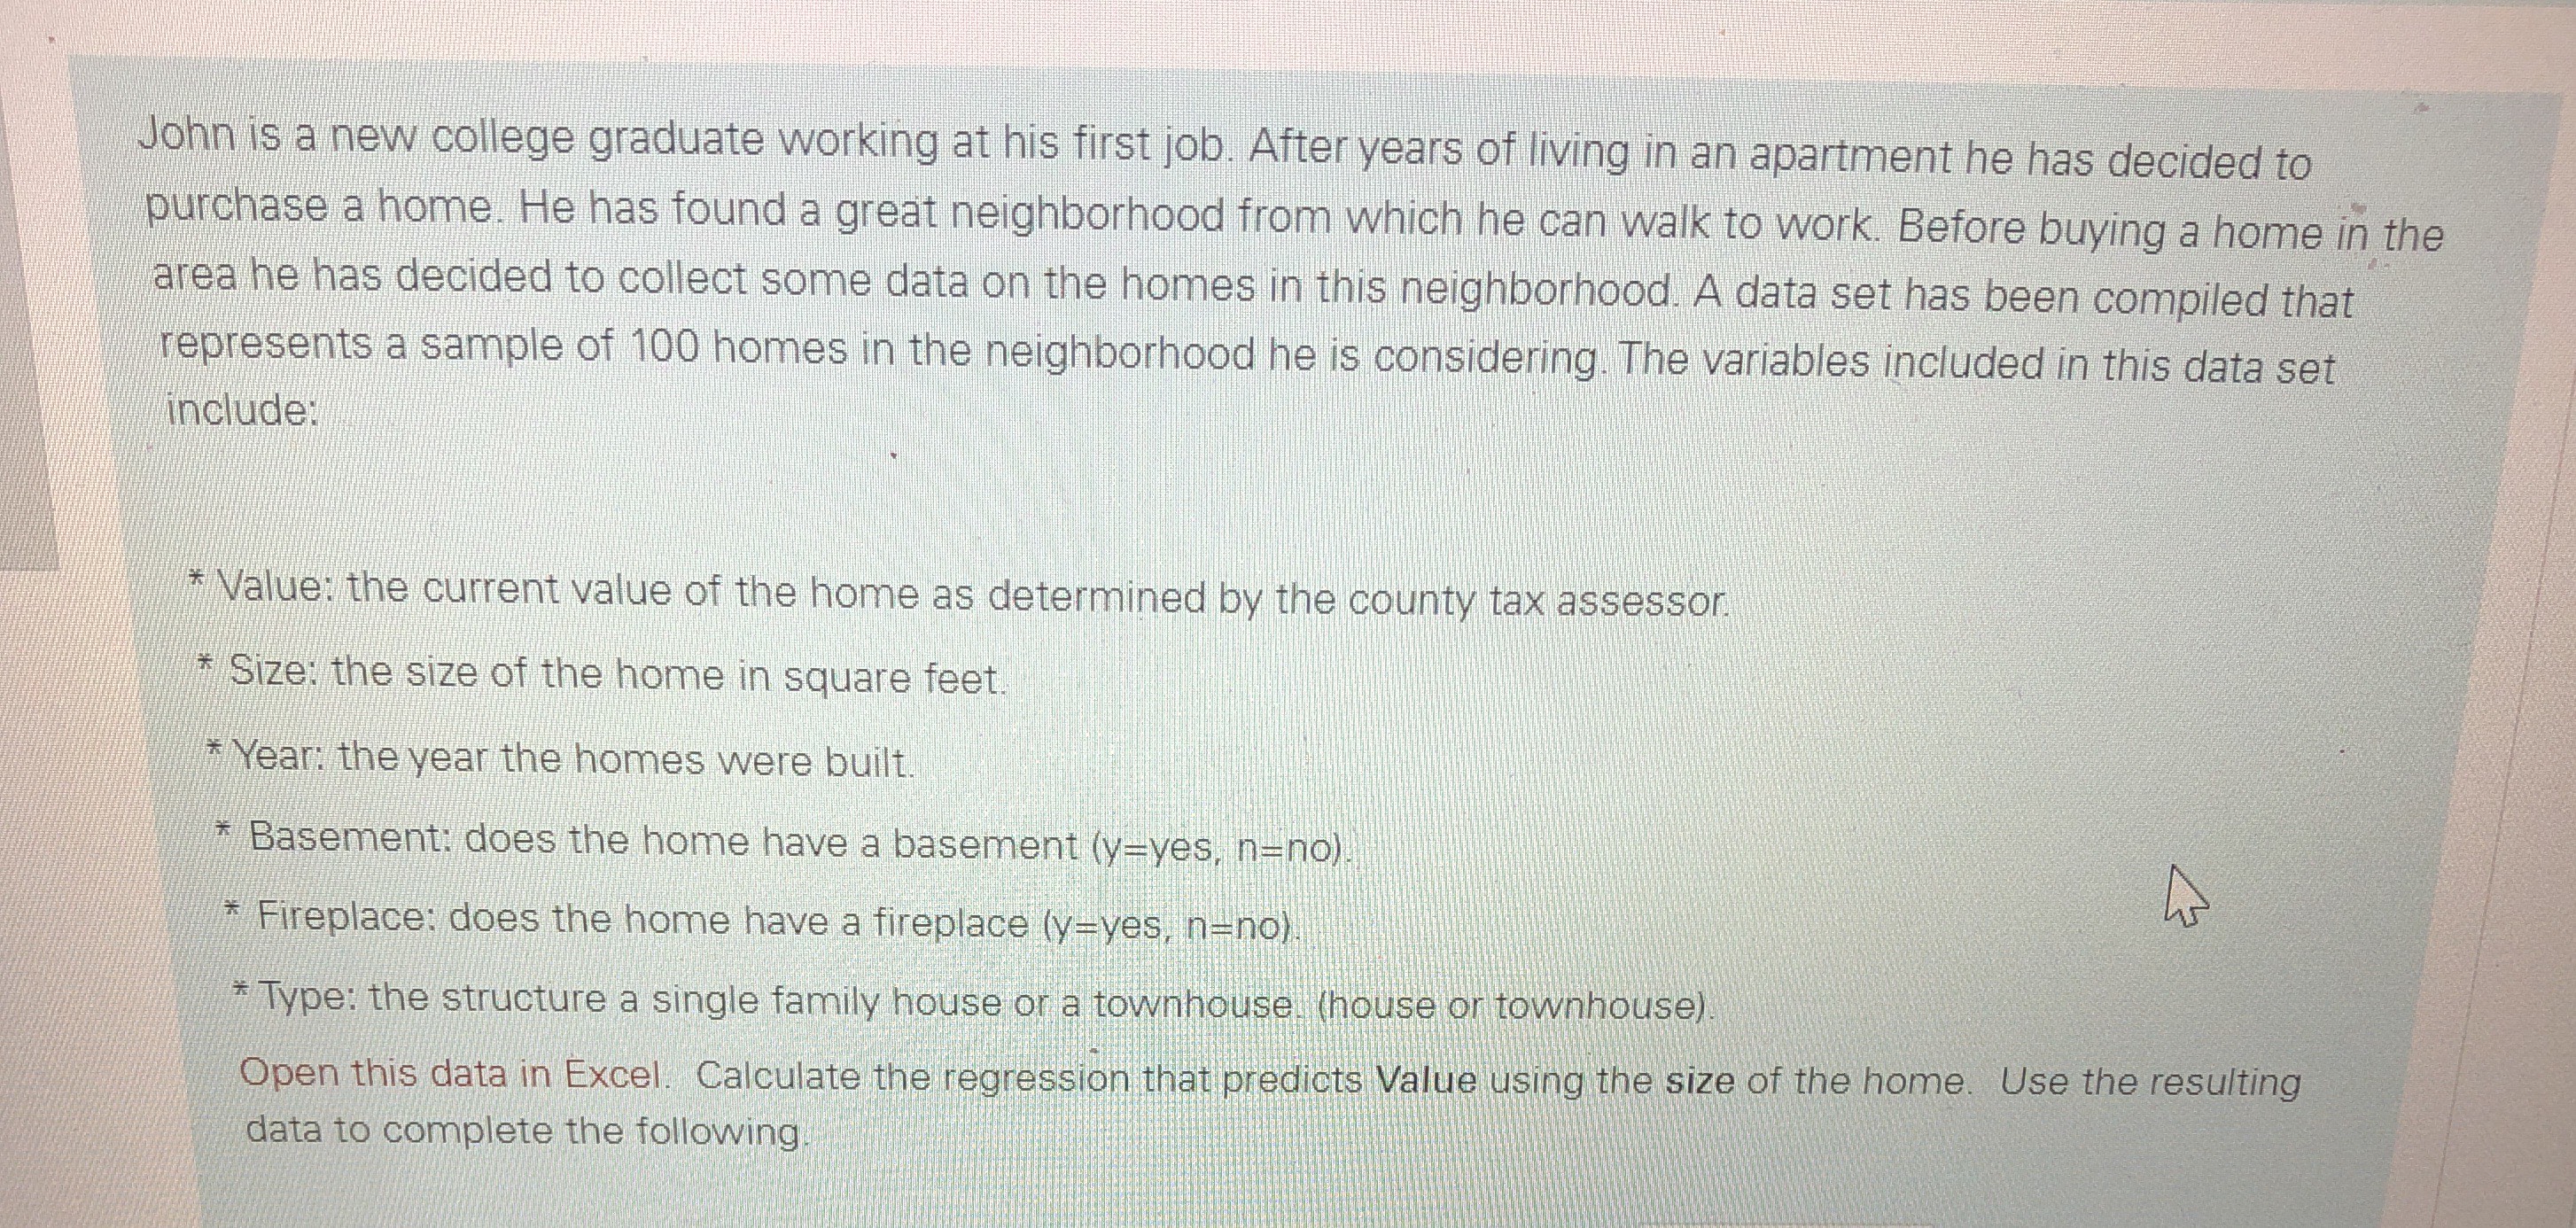
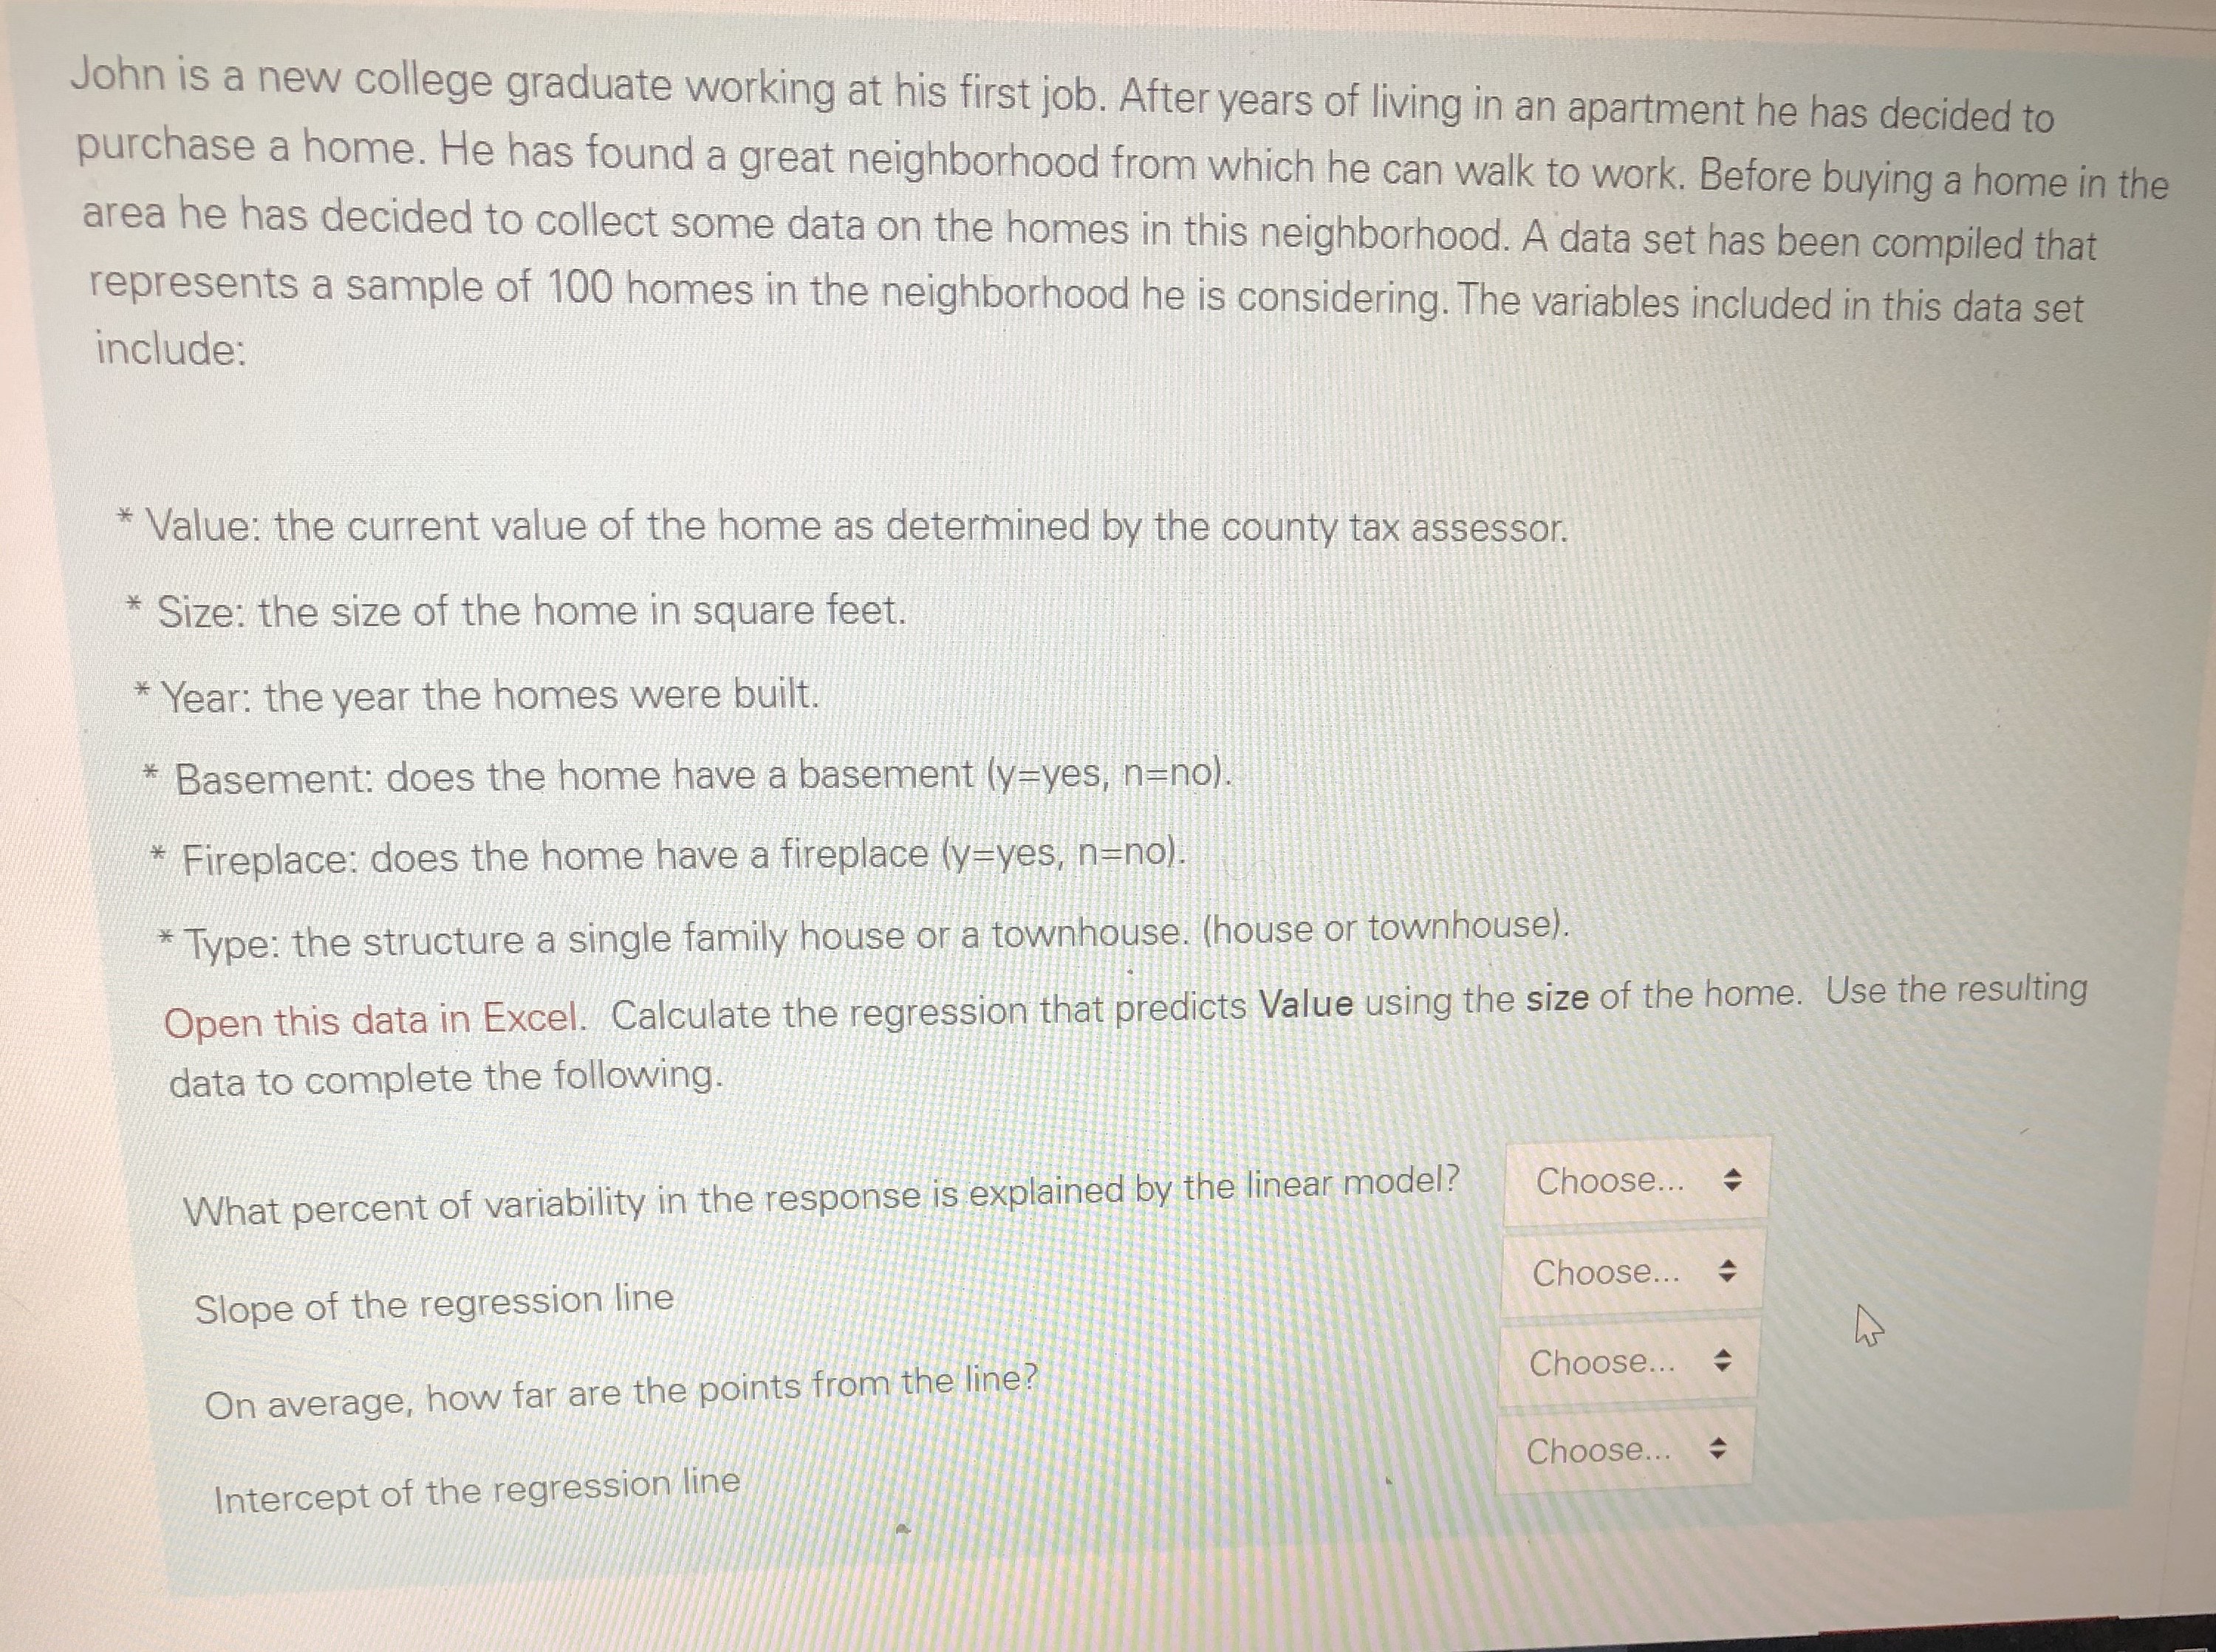
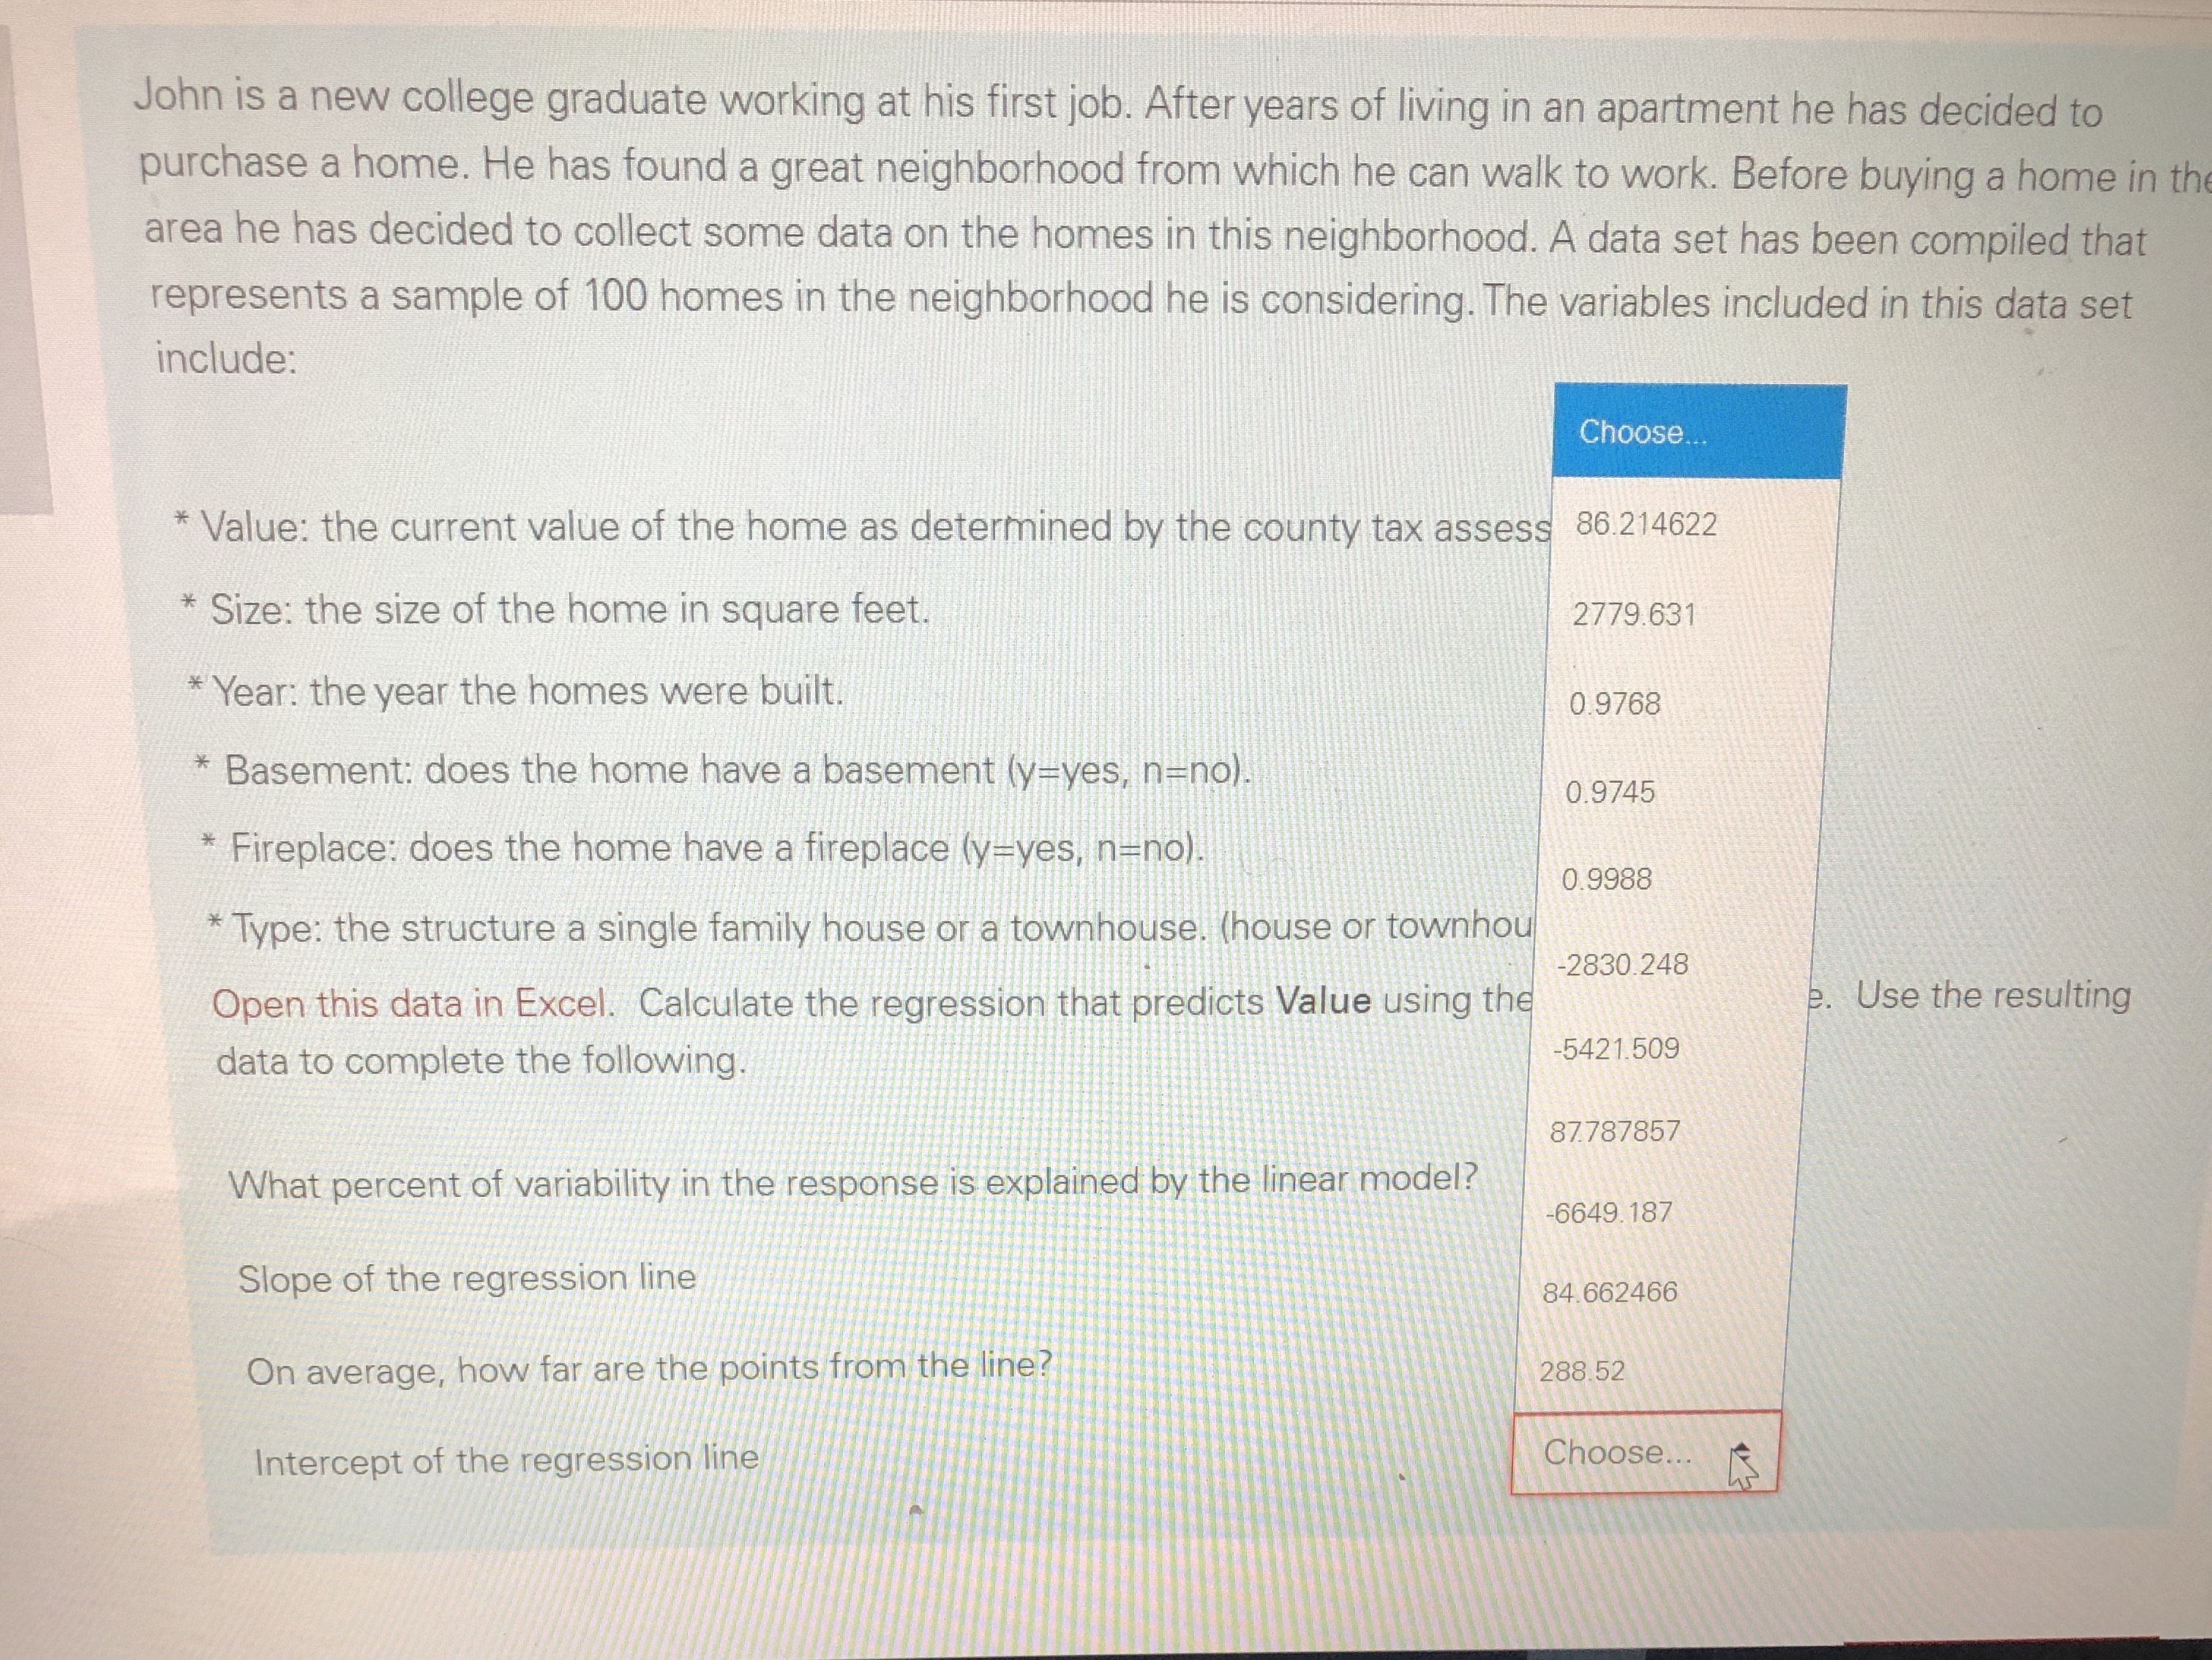
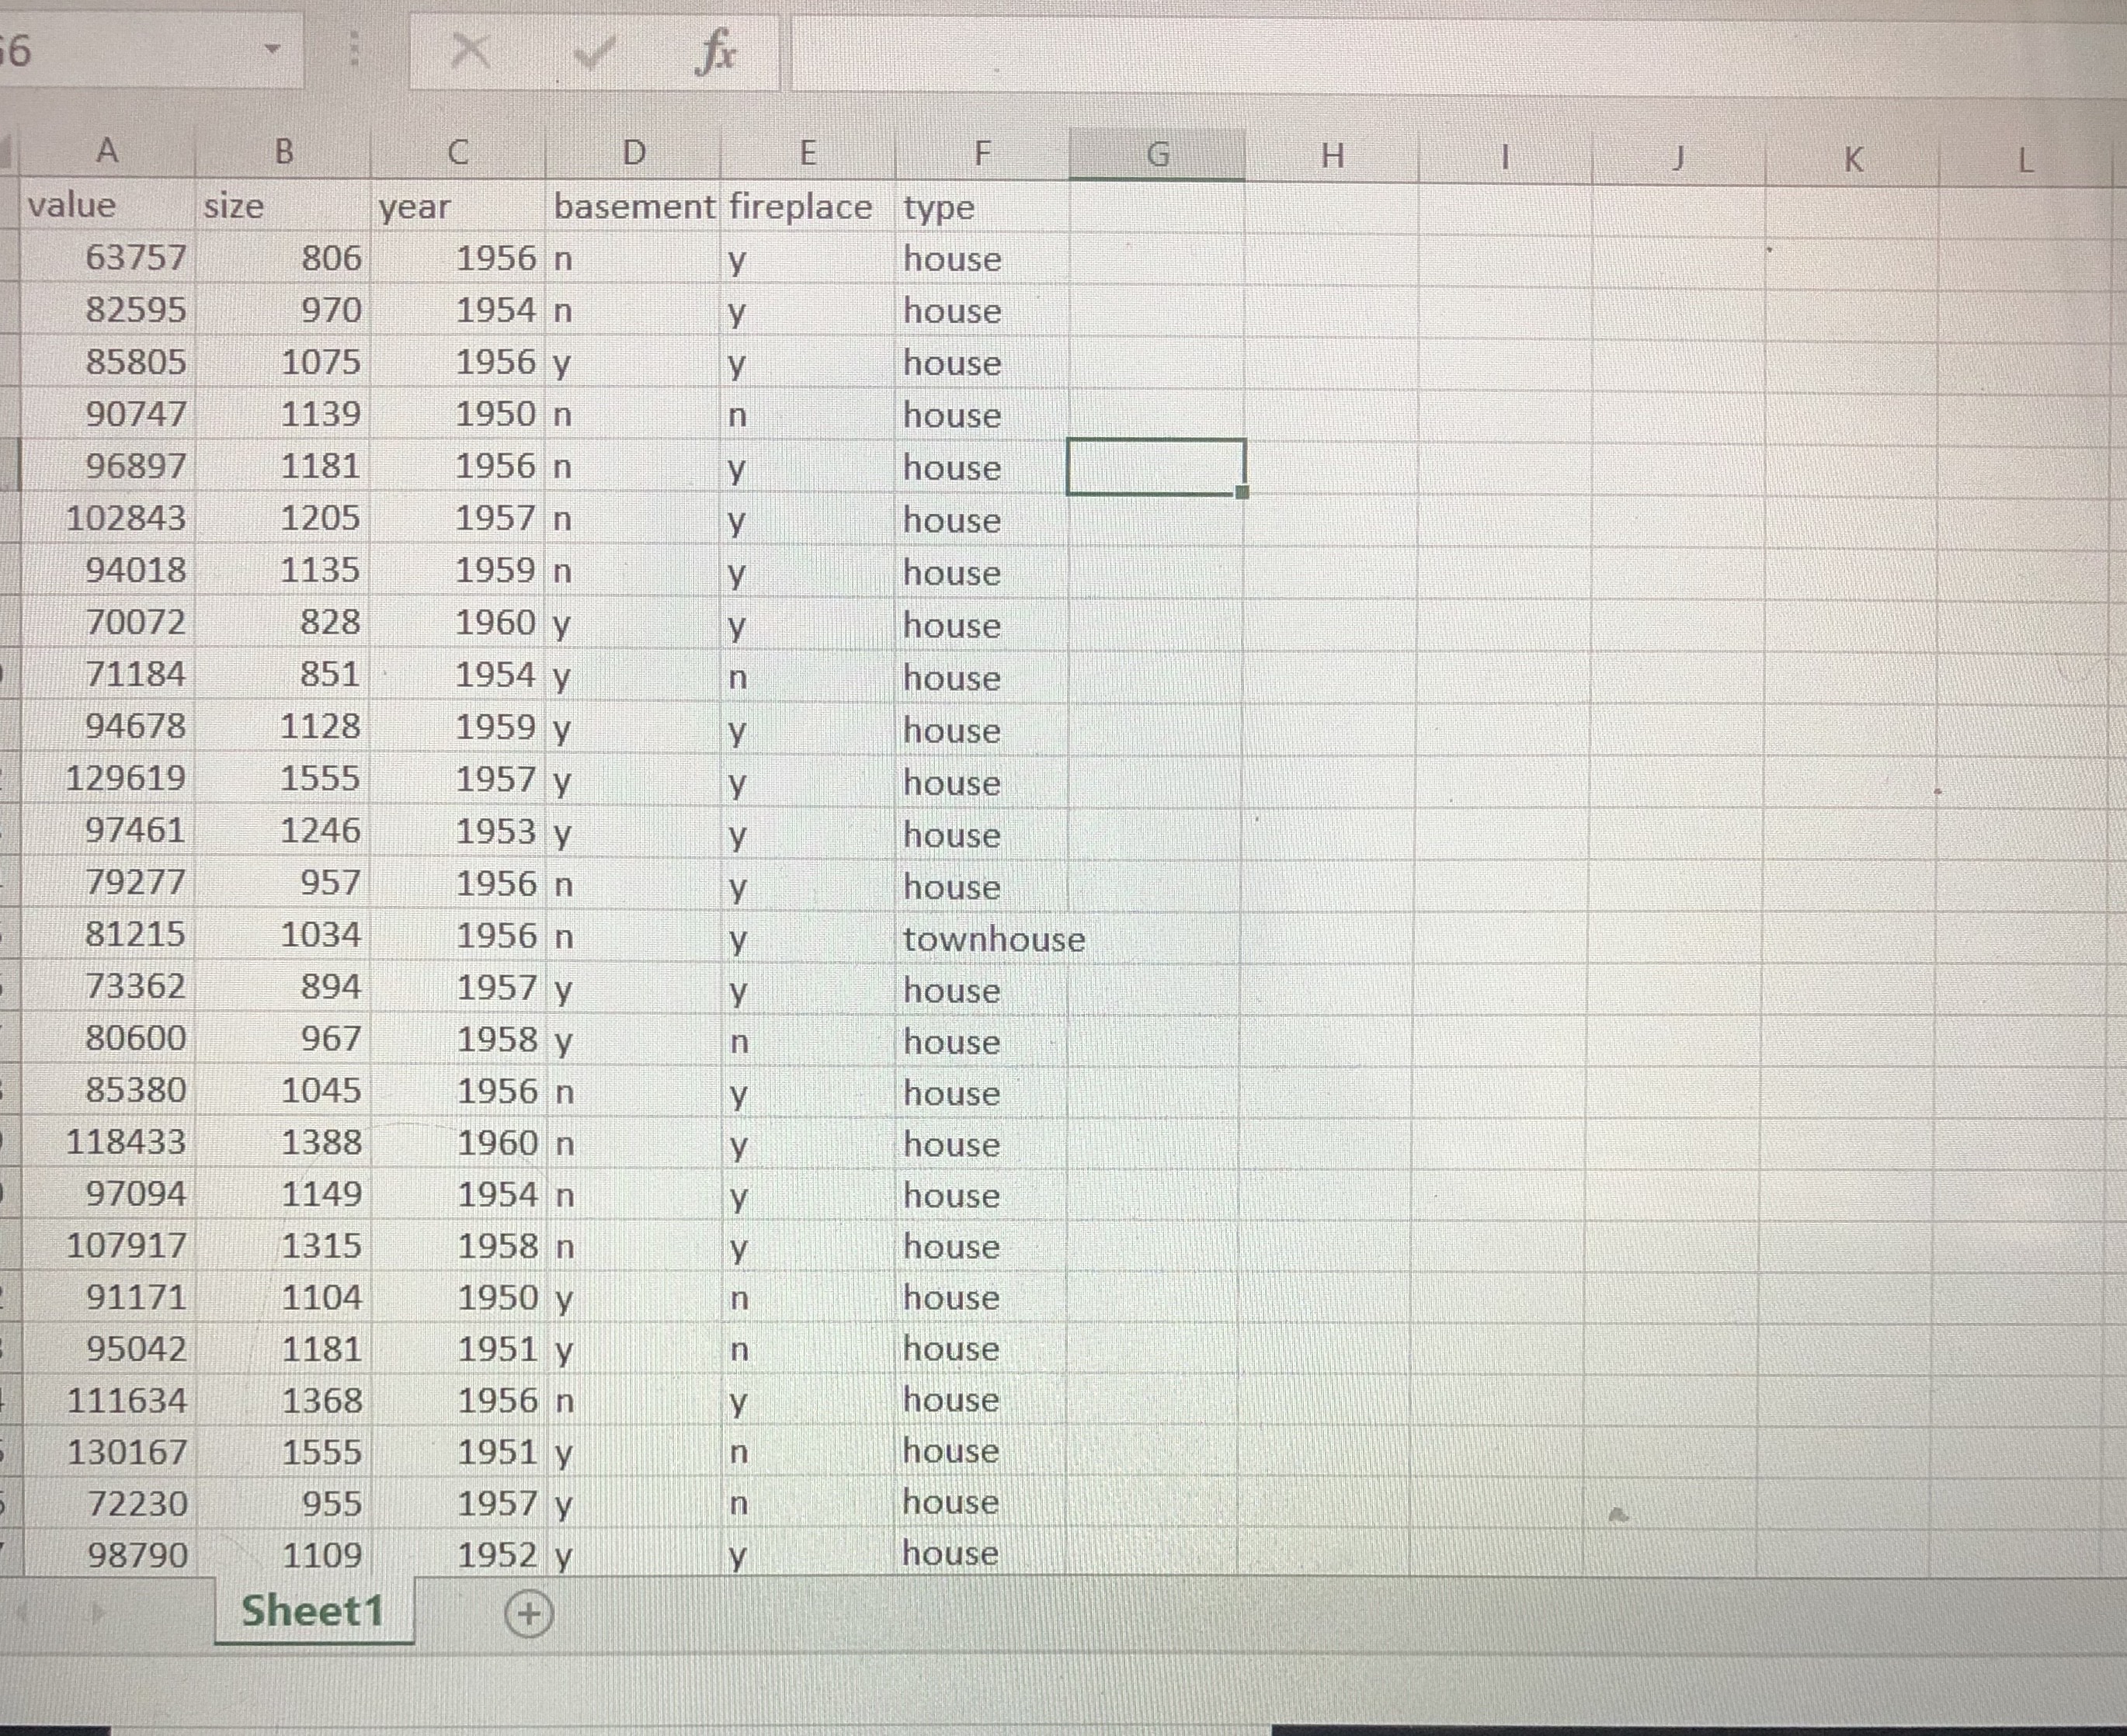
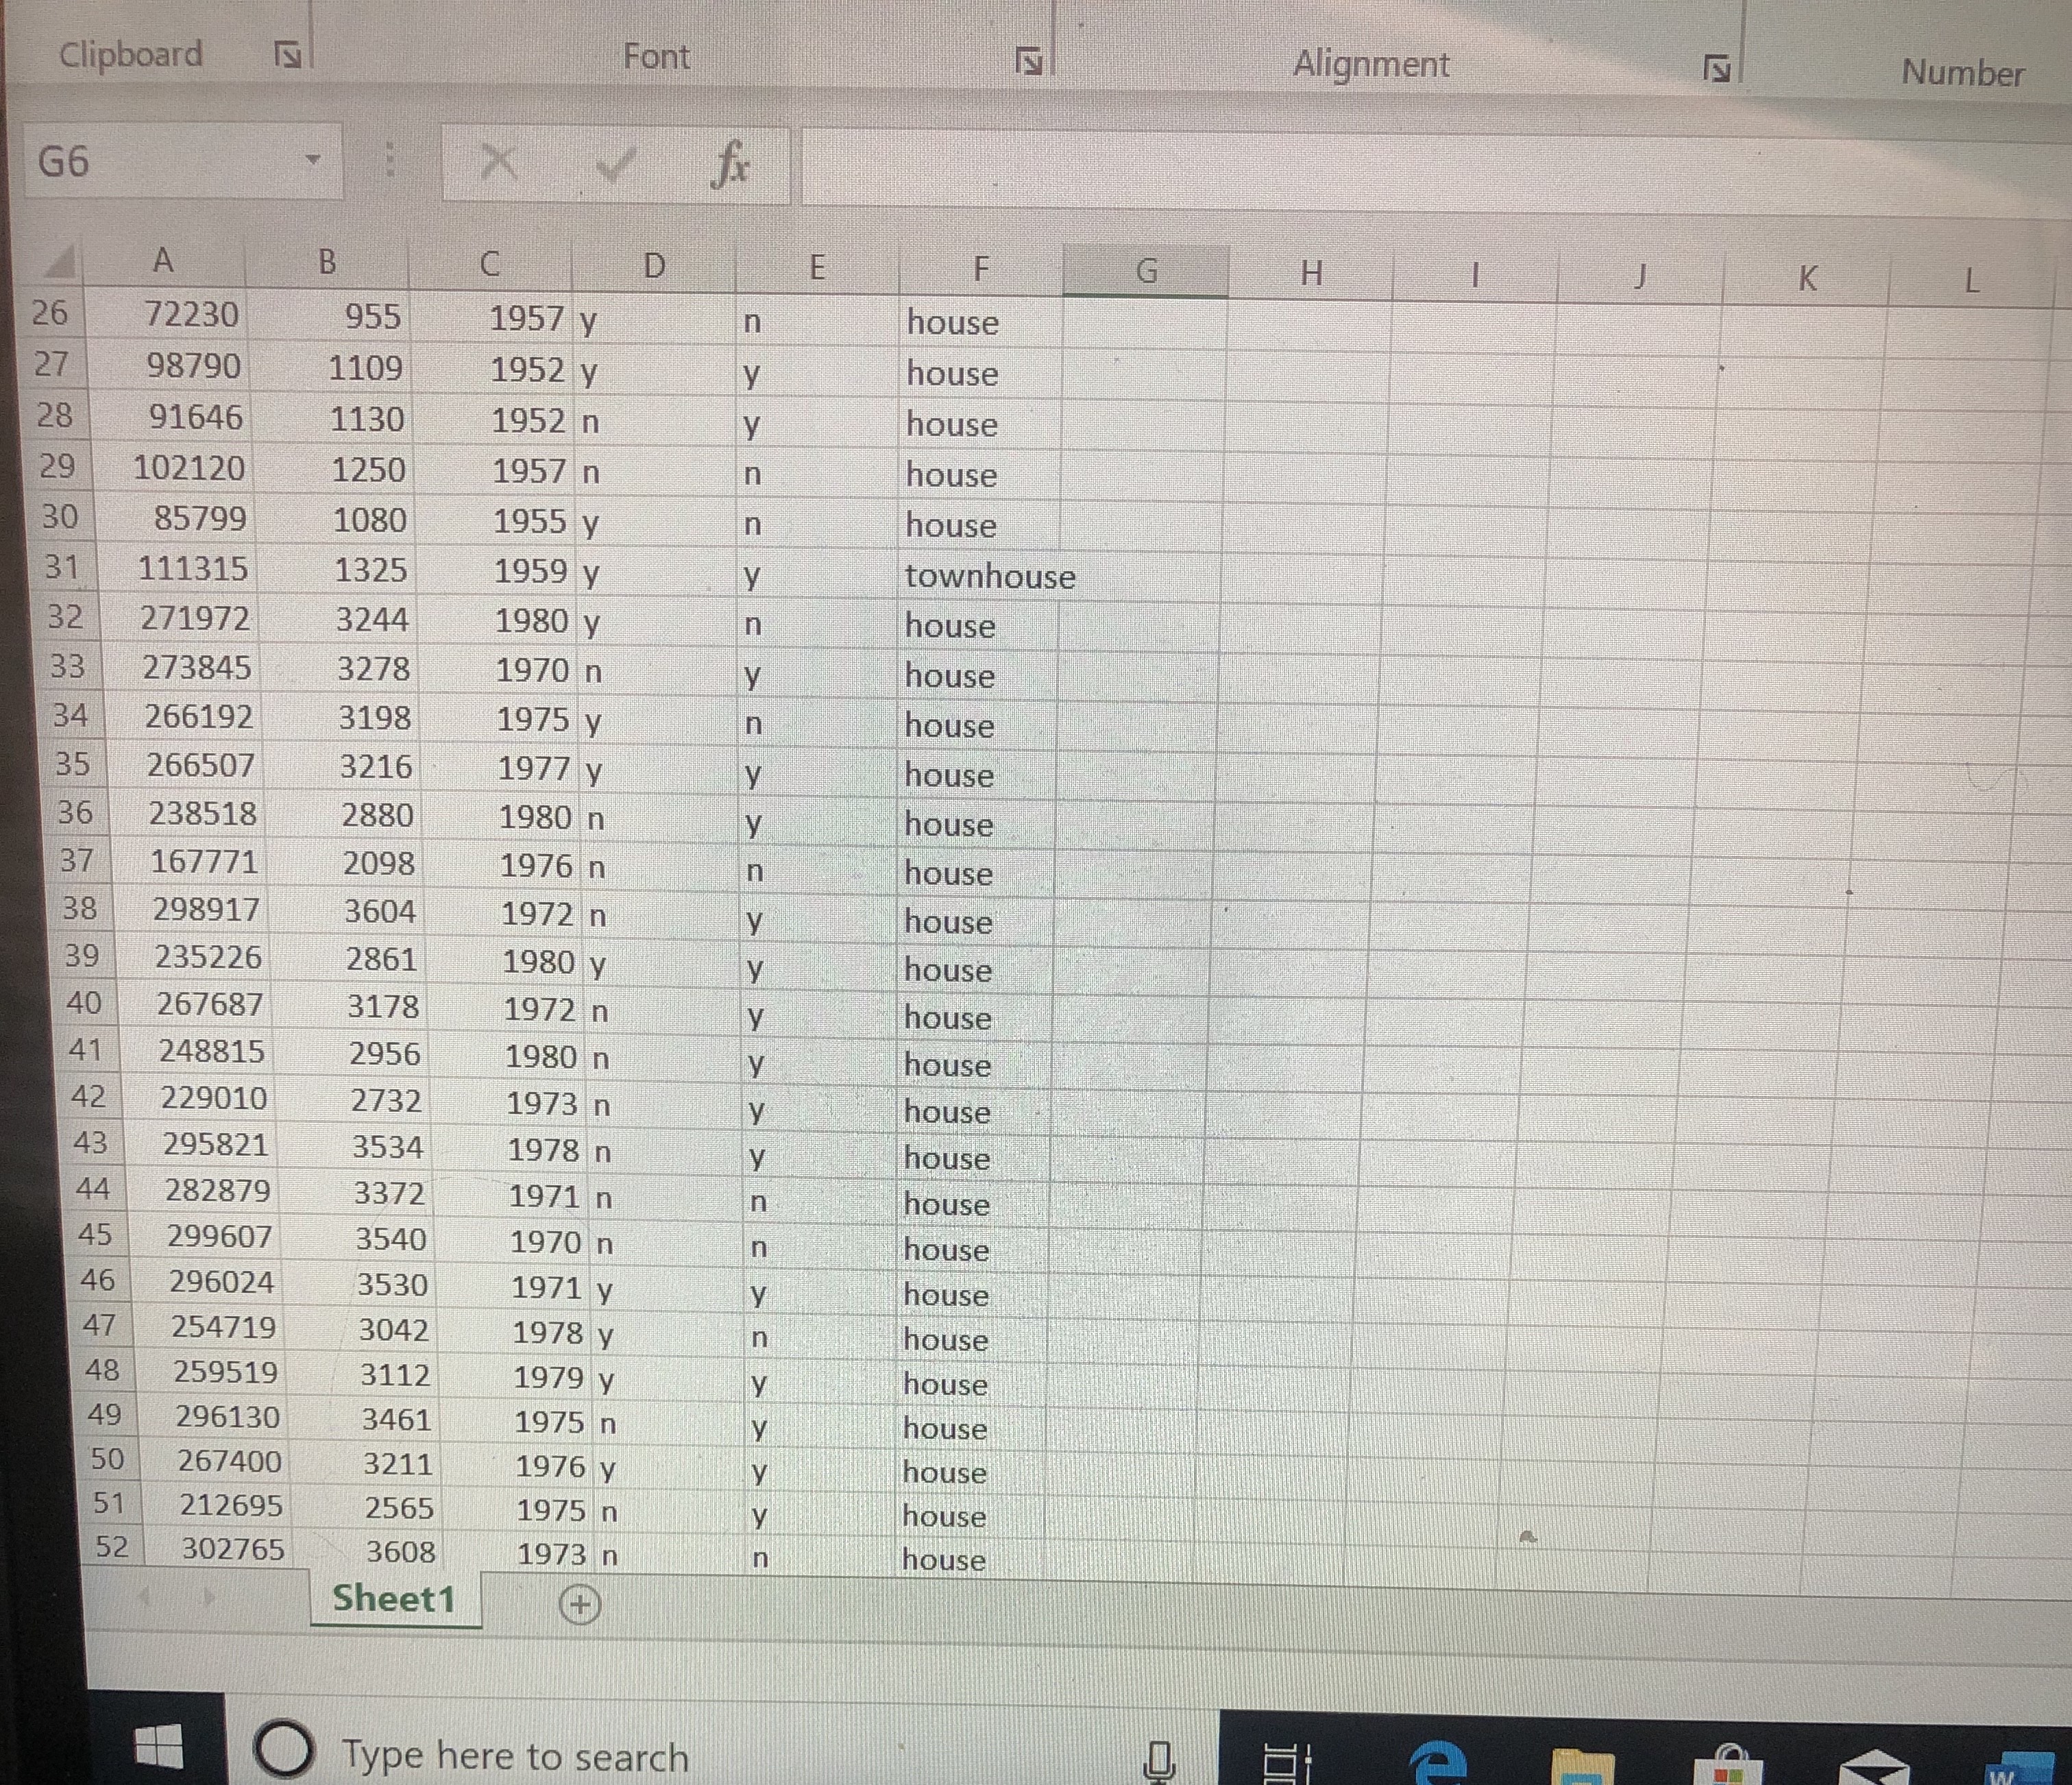
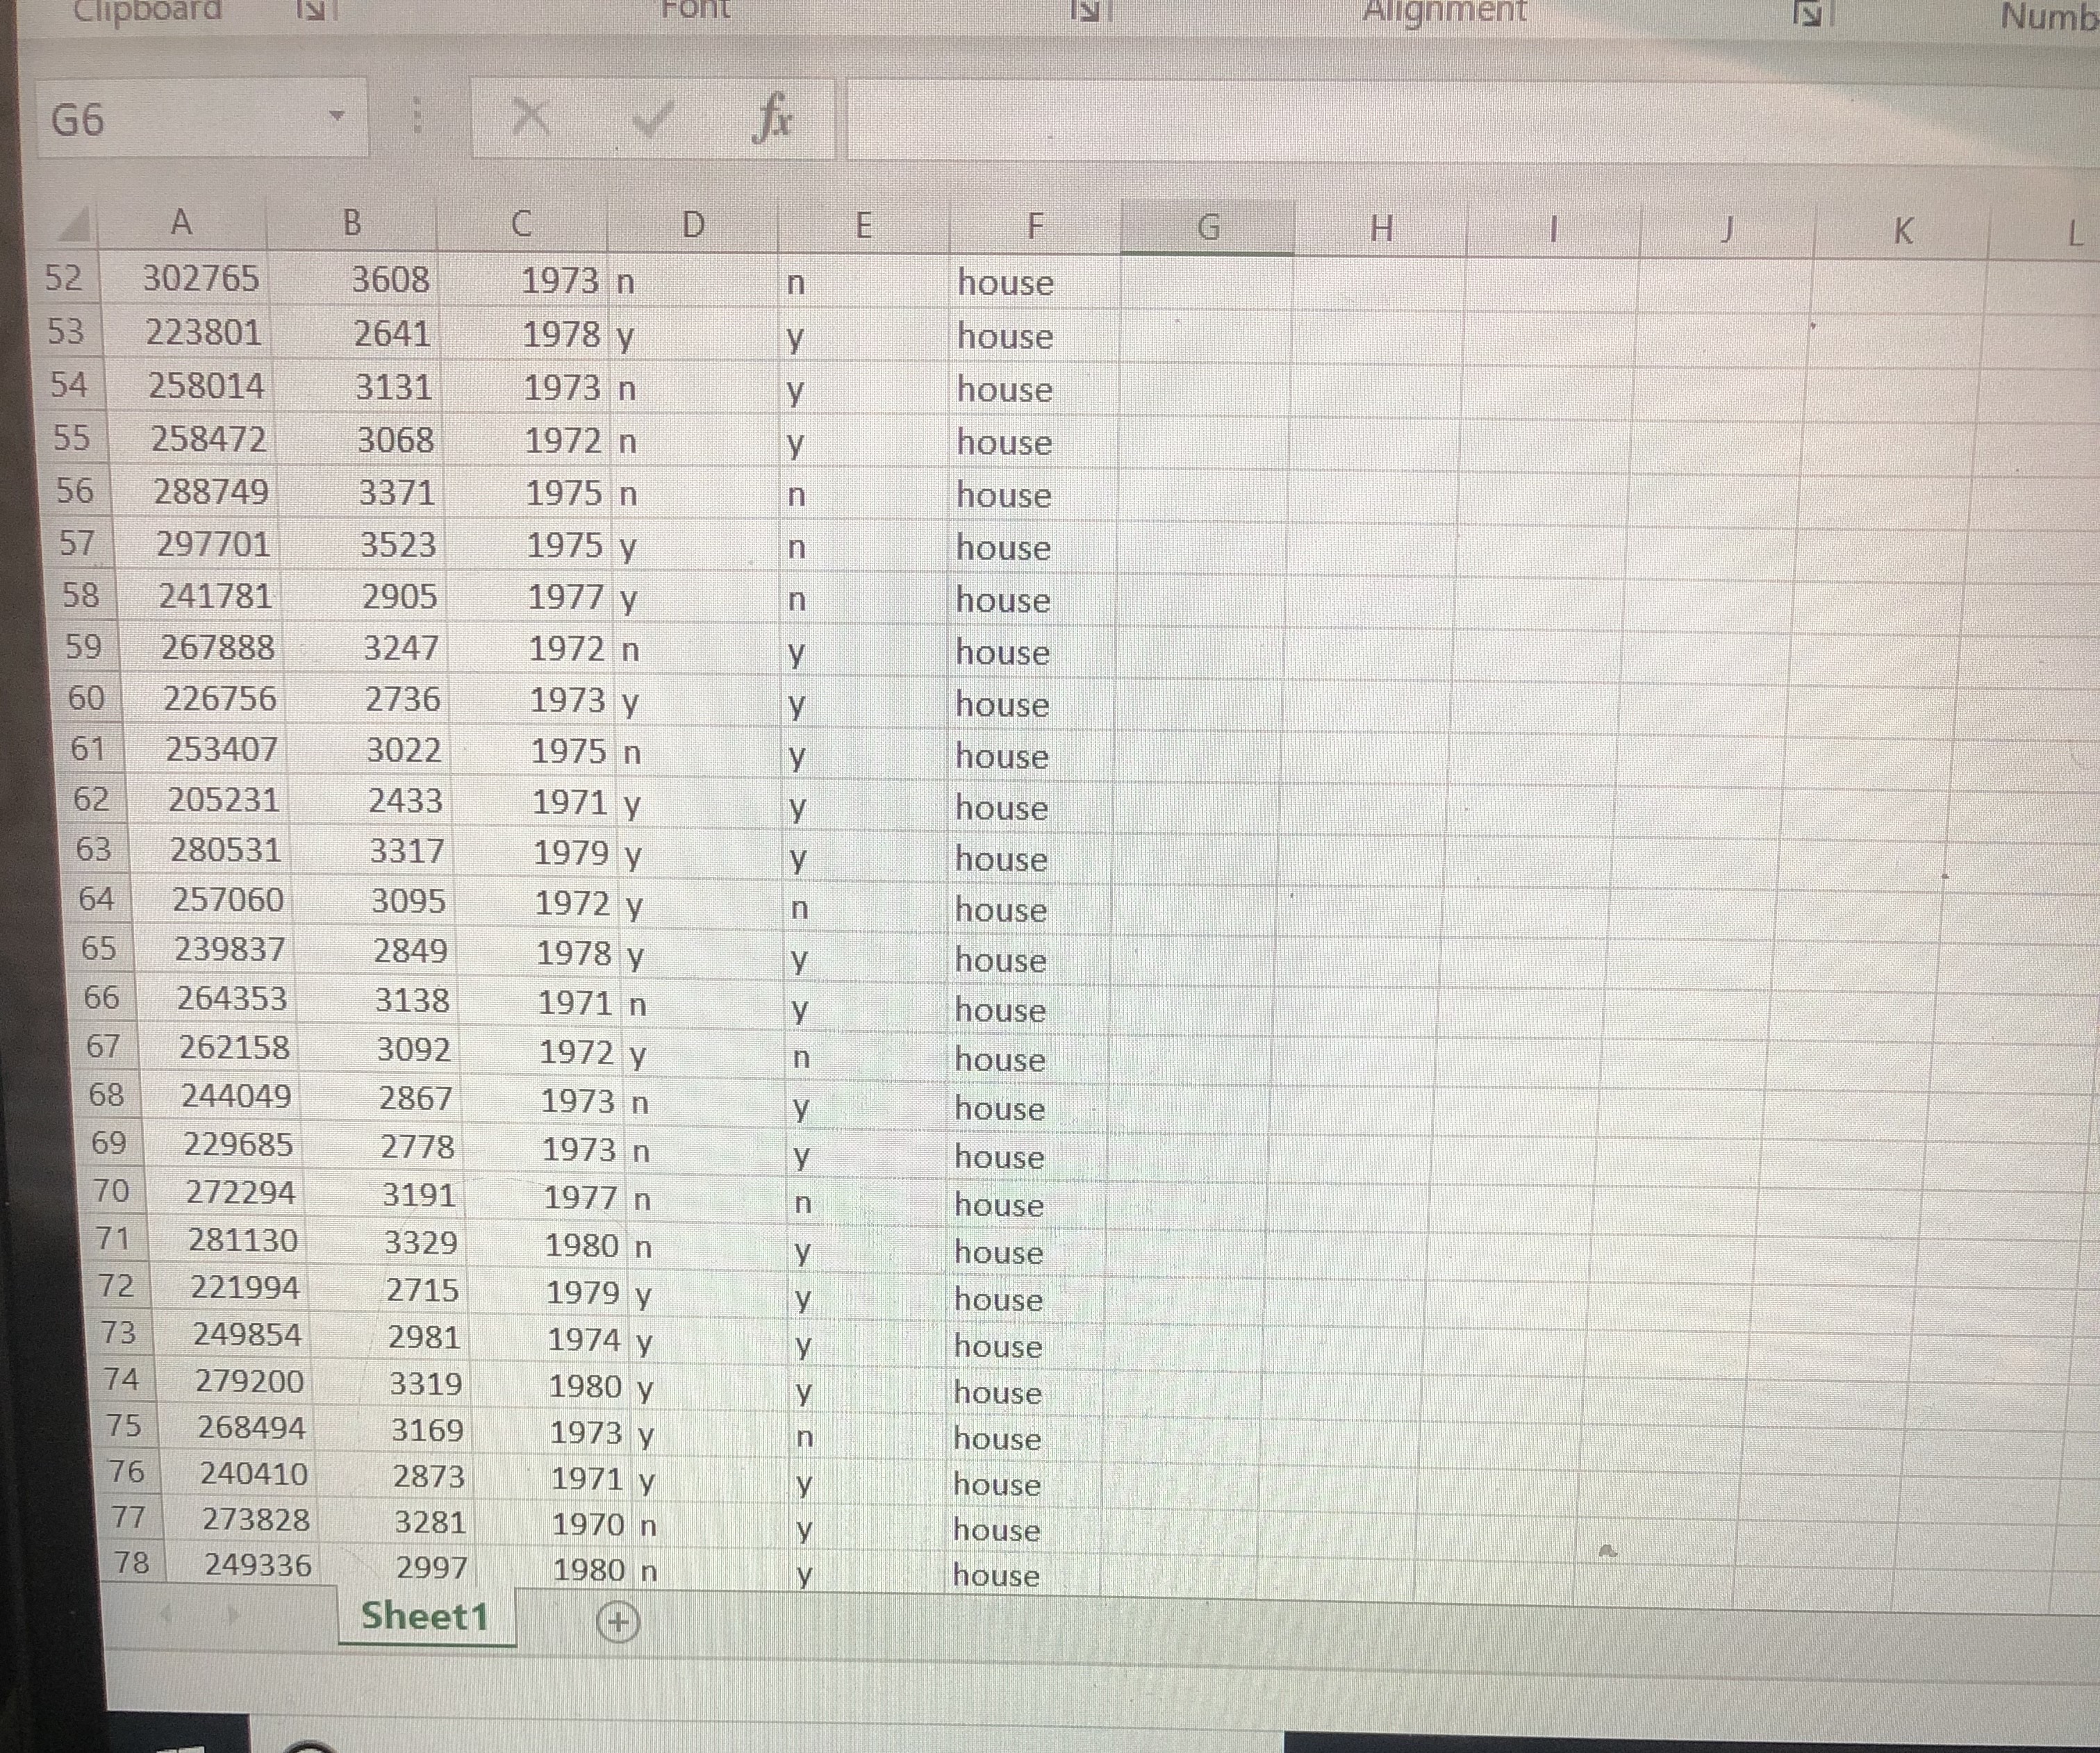
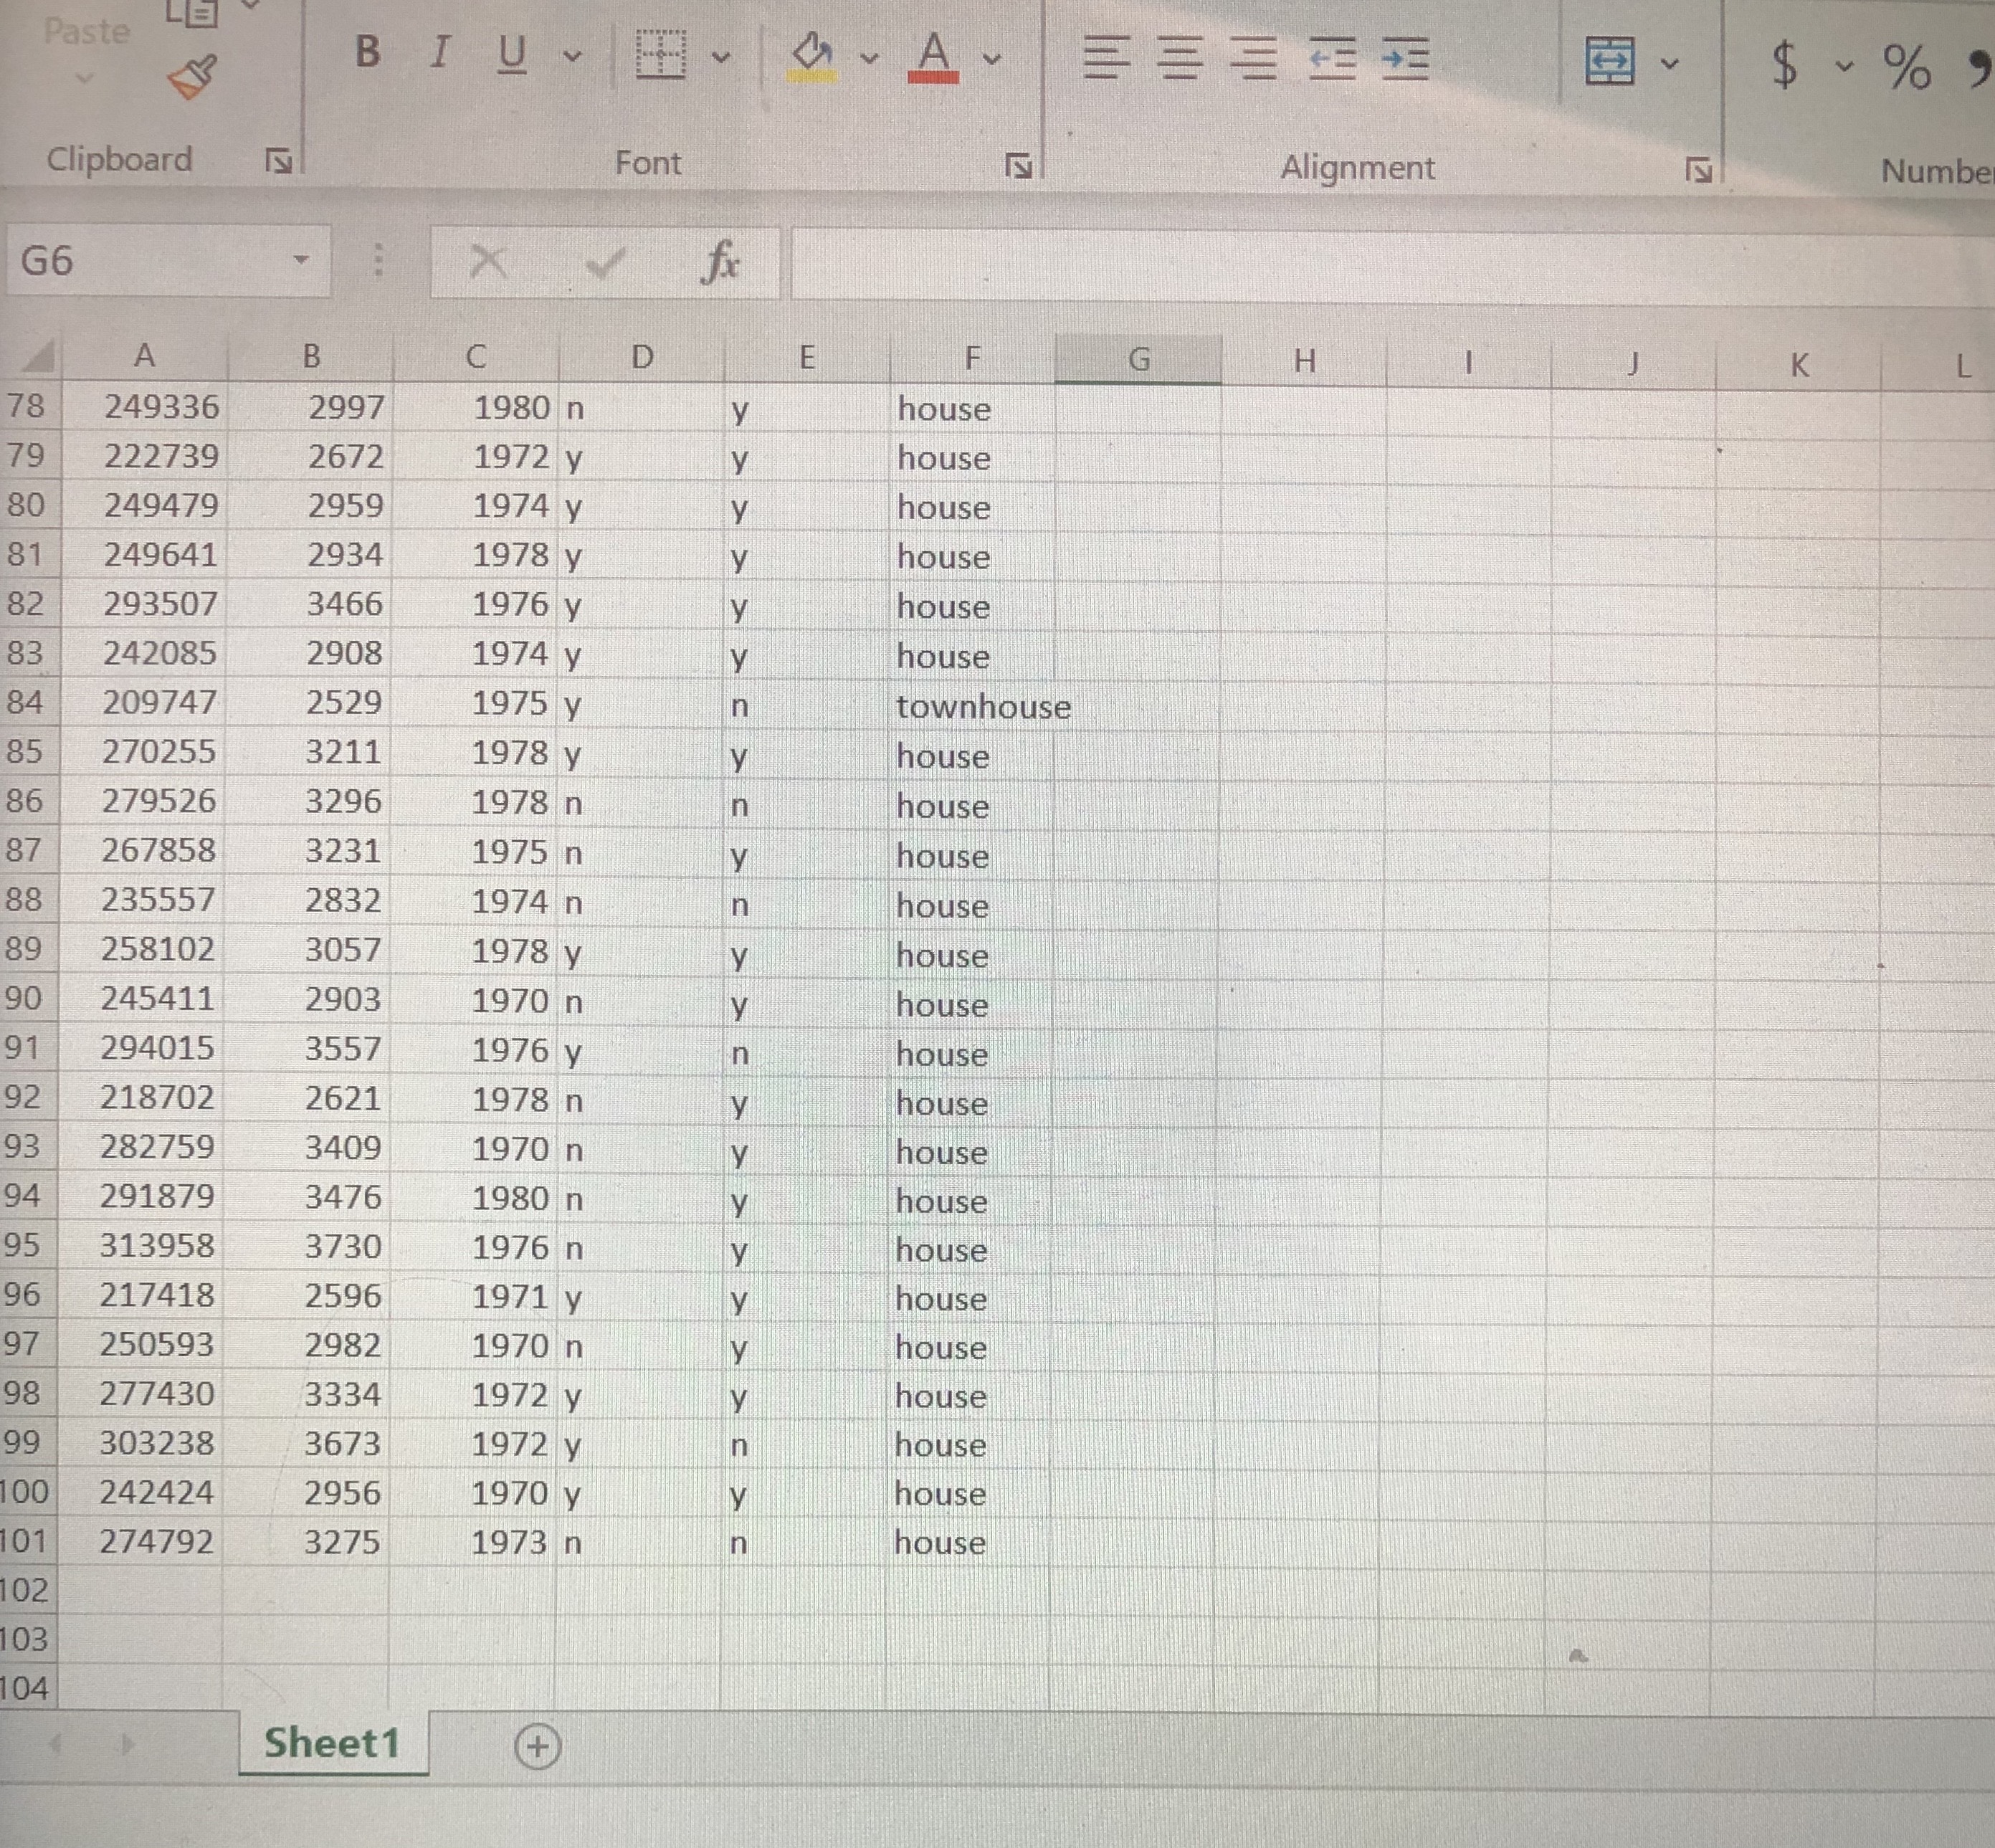
John is a new college graduate working at his first job. After years of living in an apartment he has decided to purchase a home. He has found a great neighborhood from which he can walk to work. Before buying a home in the area he has decided to collect some data on the homes in this neighborhood. A data set has been compiled that represents a sample of 100 homes in the neighborhood he is considering. The variables included in this data set include: * Value: the current value of the home as determined by the county tax assessor. * Size: the size of the home in square feet. * Year: the year the homes were built. * Basement: does the home have a basement (y-yes, n=no) * Fireplace: does the home have a fireplace (y=yes, n=no) * Type: the structure a single family house or a townhouse. (house or townhouse). Open this data in Excel. Calculate the regression that predicts Value using the size of the home. Use the resulting data to complete the followingJohn is a new college graduate working at his first job. After years of living in an apartment he has decided to purchase a home. He has found a great neighborhood from which he can walk to work. Before buying a home in the area he has decided to collect some data on the homes in this neighborhood. A data set has been compiled that represents a sample of 100 homes in the neighborhood he is considering. The variables included in this data set include: * Value: the current value of the home as determined by the county tax assessor. * Size: the size of the home in square feet. * Year: the year the homes were built. * Basement: does the home have a basement (y=yes, n=no). * Fireplace: does the home have a fireplace (y=yes, n=no). * Type: the structure a single family house or a townhouse. (house or townhouse). Open this data in Excel. Calculate the regression that predicts Value using the size of the home. Use the resulting data to complete the following. What percent of variability in the response is explained by the linear model? Choose... Slope of the regression line Choose... On average, how far are the points from the line? Choose... Intercept of the regression line Choose...John is a new college graduate working at his first job. After years of living in an apartment he has decided to purchase a home. He has found a great neighborhood from which he can walk to work. Before buying a home in th area he has decided to collect some data on the homes in this neighborhood. A data set has been compiled that represents a sample of 100 homes in the neighborhood he is considering. The variables included in this data set include: Choose. * Value: the current value of the home as determined by the county tax assess 86.214622 * Size: the size of the home in square feet. 2779.631 * Year: the year the homes were built. 0.9768 * Basement: does the home have a basement (y=yes, n=no) 0.9745 * Fireplace: does the home have a fireplace (y=yes, n=no). 0.9988 * Type: the structure a single family house or a townhouse. (house or townhou -2830.248 Open this data in Excel. Calculate the regression that predicts Value using the e. Use the resulting data to complete the following. -5421.509 87.787857 What percent of variability in the response is explained by the linear model? -6649. 187 Slope of the regression line 84.662466 On average, how far are the points from the line? 288.52 Intercept of the regression line Choose...16 X V fx A B C D E F G H K L value size year basement fireplace type 63757 806 1956 n house 82595 970 1954 n house 85805 1075 1956 y house 90747 1139 1950 n house 96897 1181 1956 n house 102843 1205 1957 n house 94018 1135 1959 n house 70072 828 1960 y house 71184 851 1954 y house 94678 1128 1959 y house 129619 1555 1957 y y house 97461 1246 1953 y y house 79277 957 1956 n y house 81215 1034 1956 n townhouse 73362 894 1957 y y house 80600 967 1958 y n house 85380 1045 1956 n y house 118433 1388 1960 n house 97094 1149 1954 n house 107917 1315 1958 n house 91171 1104 1950 y n house 95042 1181 1951 y n house 111634 1368 1956 n y house 130167 1555 1951 y n house 72230 955 1957 y n house 98790 1109 1952 y house Sheet1 +Clipboard IS Font IN Alignment IN Number G6 X V f A B C D E F G H K L 26 72230 955 1957 y n house 27 98790 1109 1952 y house 28 91646 1130 1952 n house 29 102120 1250 1957 n house 30 85799 1080 1955 y 3 3