

Answered step by step
Verified Expert Solution
Question
1 Approved Answer
sorry Q2: The admission in university (ADMIT: Yes-1, No-0) presumably depends on GRE score, GPA and rank of the university (RANK: 1.2.3.4). The data has
sorry
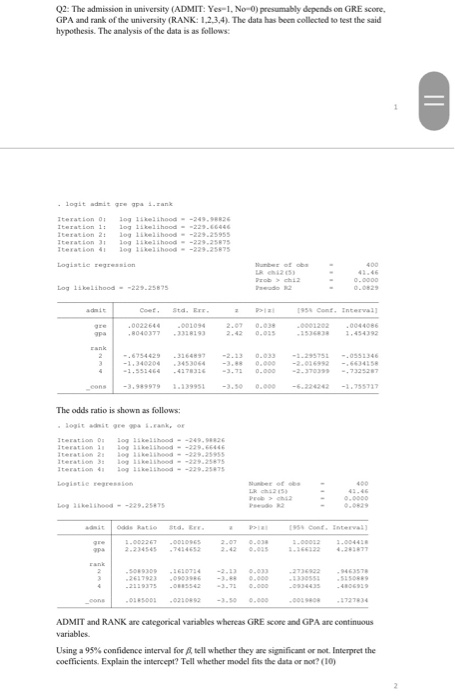
Q2: The admission in university (ADMIT: Yes-1, No-0) presumably depends on GRE score, GPA and rank of the university (RANK: 1.2.3.4). The data has been collected to test the said hypothesis. The analysis of the data is as follows: = logit admit grepa sank Iteration 0; log 1 kelthood --249.98826 Iteration 1: log likelihood --229.6646 Iteration 2: log likelihood --229.25955 Iteration i og likelihood --229.25875 Teration 1 og likelihood --229.25875 Logistie regression 400 0.0000 Log likelihood --229.25875 Std. Er Coet. .0022640 .804077 1958 Cont. Intervall 0001202 004 gre .001094 0.015 2 -1.340200 -1.551464 .316689 3453064 . 427831 0.000 0.000 -.663458 -32527 -6.224242-1.755717 The odds ratio is shown as follows: logit dit geepa Irank, Iteration : 109 kelihood --240.01226 Iteration i 109 kelihood --229.66446 teration 2 1 likelihood --229.25955 teration 3: lo kehood --229.25875 Iteration 4 109 kelihood --229.25875 Logistie recension LR 25 Logibelihood --229.25875 Odds ratio Std. ter. .DIDES 2.234545 195 cont. Interval) 1.000 1.004418 .2610714 2736922 .946357 .2617923 -2119375 .018500 . 1727834 ADMIT and RANK are categorical variables whereas GRE score and GPA are continuous variables. Using a 95% confidence interval for A tell whether they are significant or not. Interpret the coefficients. Explain the intercept? Tell whether model fits the data or not? (10) Q2: The admission in university (ADMIT: Yes-1, No-0) presumably depends on GRE score, GPA and rank of the university (RANK: 1.2.3.4). The data has been collected to test the said hypothesis. The analysis of the data is as follows: = logit admit grepa sank Iteration 0; log 1 kelthood --249.98826 Iteration 1: log likelihood --229.6646 Iteration 2: log likelihood --229.25955 Iteration i og likelihood --229.25875 Teration 1 og likelihood --229.25875 Logistie regression 400 0.0000 Log likelihood --229.25875 Std. Er Coet. .0022640 .804077 1958 Cont. Intervall 0001202 004 gre .001094 0.015 2 -1.340200 -1.551464 .316689 3453064 . 427831 0.000 0.000 -.663458 -32527 -6.224242-1.755717 The odds ratio is shown as follows: logit dit geepa Irank, Iteration : 109 kelihood --240.01226 Iteration i 109 kelihood --229.66446 teration 2 1 likelihood --229.25955 teration 3: lo kehood --229.25875 Iteration 4 109 kelihood --229.25875 Logistie recension LR 25 Logibelihood --229.25875 Odds ratio Std. ter. .DIDES 2.234545 195 cont. Interval) 1.000 1.004418 .2610714 2736922 .946357 .2617923 -2119375 .018500 . 1727834 ADMIT and RANK are categorical variables whereas GRE score and GPA are continuous variables. Using a 95% confidence interval for A tell whether they are significant or not. Interpret the coefficients. Explain the intercept? Tell whether model fits the data or not Step by Step Solution
There are 3 Steps involved in it
Step: 1

Get Instant Access to Expert-Tailored Solutions
See step-by-step solutions with expert insights and AI powered tools for academic success
Step: 2

Step: 3
Ace Your Homework with AI
Get the answers you need in no time with our AI-driven, step-by-step assistance
Get Started
The Marketing Audit Translating Marketing Theory Into Practice The Marketing Series
Authors: Malcolm McDonald
1st Edition
0750600896, 978-0750600897