

Answered step by step
Verified Expert Solution
Question
1 Approved Answer
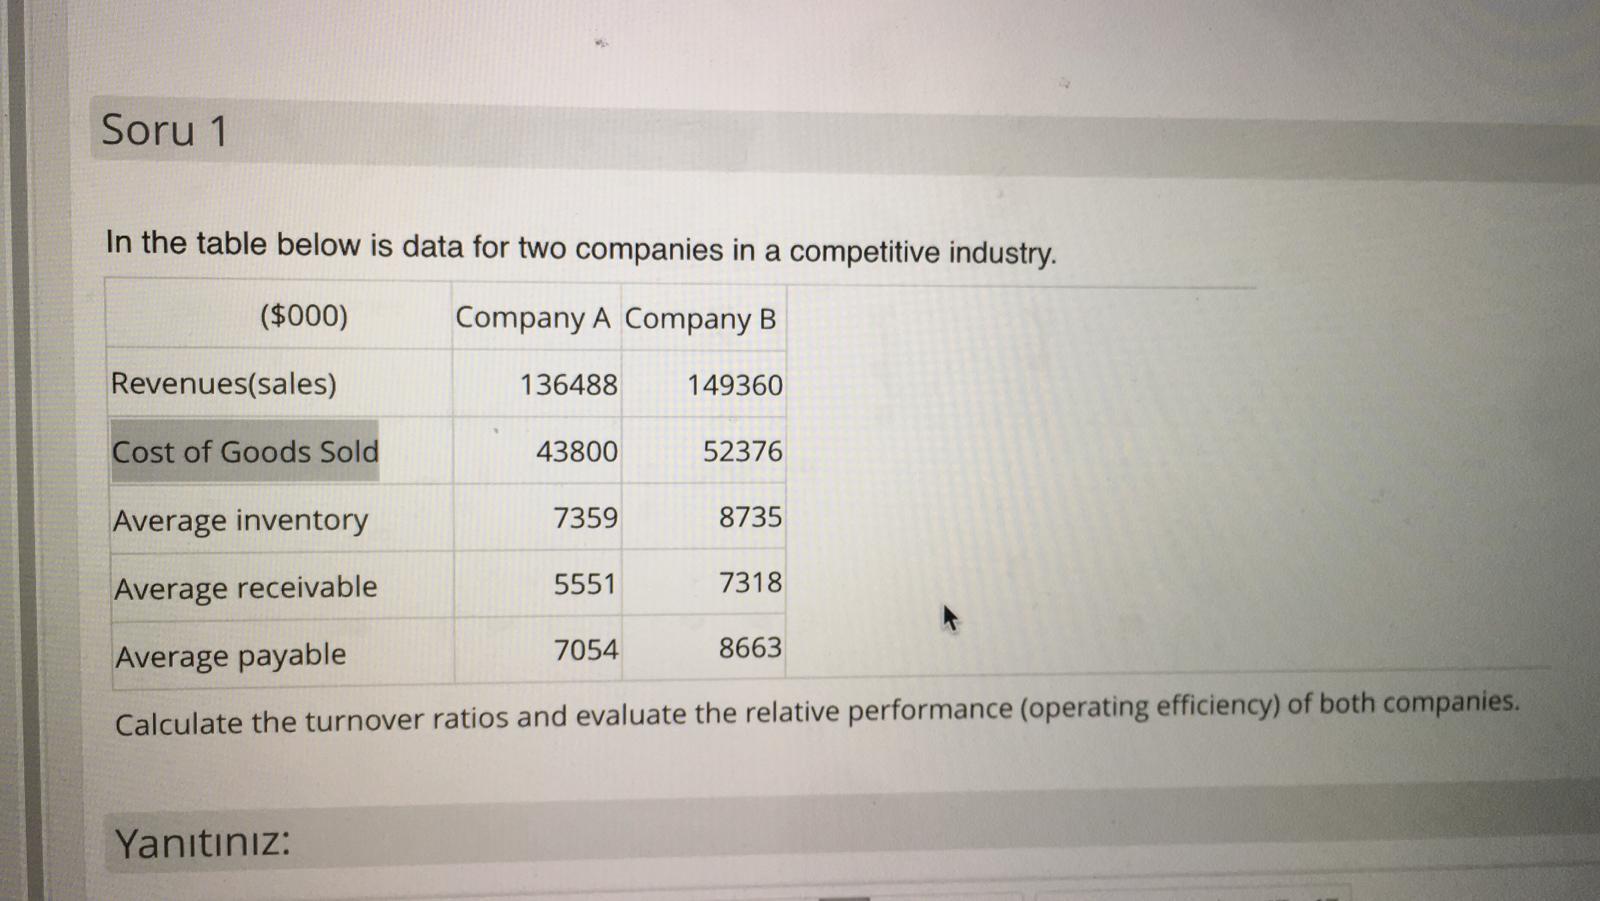
Soru 1 In the table below is data for two companies in a competitive industry. ($000) Company A Company B Revenues(sales) 136488 149360 Cost of
Step by Step Solution
There are 3 Steps involved in it
Step: 1

Get Instant Access to Expert-Tailored Solutions
See step-by-step solutions with expert insights and AI powered tools for academic success
Step: 2

Step: 3
Ace Your Homework with AI
Get the answers you need in no time with our AI-driven, step-by-step assistance
Get Started
Financial Planning & Analysis And Performance Management
Authors: Jack Alexander
1st Edition
1119491487, 9781119491484