

Question
South Shore Construction builds permanent docks and seawalls along the southern shore of long island, new york. Although the firm has been in business for
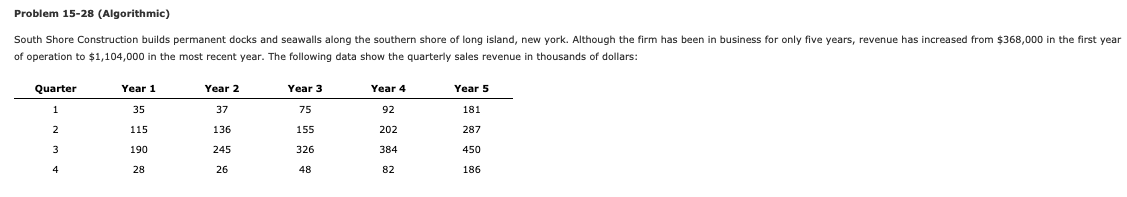
South Shore Construction builds permanent docks and seawalls along the southern shore of long island, new york. Although the firm has been in business for only five years, revenue has increased from $368,000 in the first year of operation to $1,104,000 in the most recent year. The following data show the quarterly sales revenue in thousands of dollars:
QuarterYear 1Year 2Year 3Year 4Year 5 1 35 37 75 92 181 2 115 136 155 202 287 3 190 245 326 384 450 428264882186
Step by Step Solution
There are 3 Steps involved in it
Step: 1

Get Instant Access to Expert-Tailored Solutions
See step-by-step solutions with expert insights and AI powered tools for academic success
Step: 2

Step: 3
Ace Your Homework with AI
Get the answers you need in no time with our AI-driven, step-by-step assistance
Get Started
Introduction to Probability
Authors: Mark Daniel Ward, Ellen Gundlach
1st edition
716771098, 978-1319060893, 1319060897, 978-0716771098