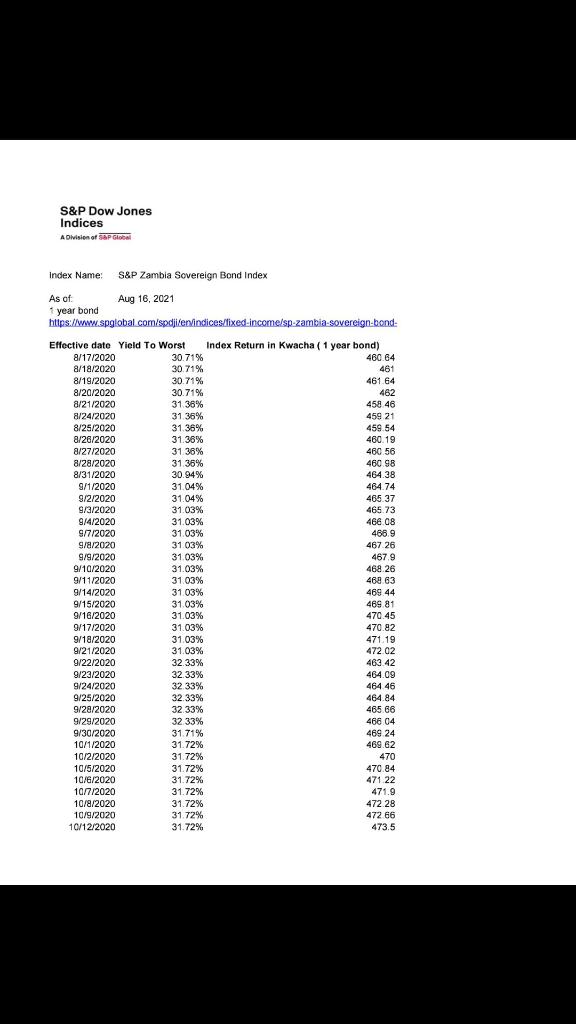
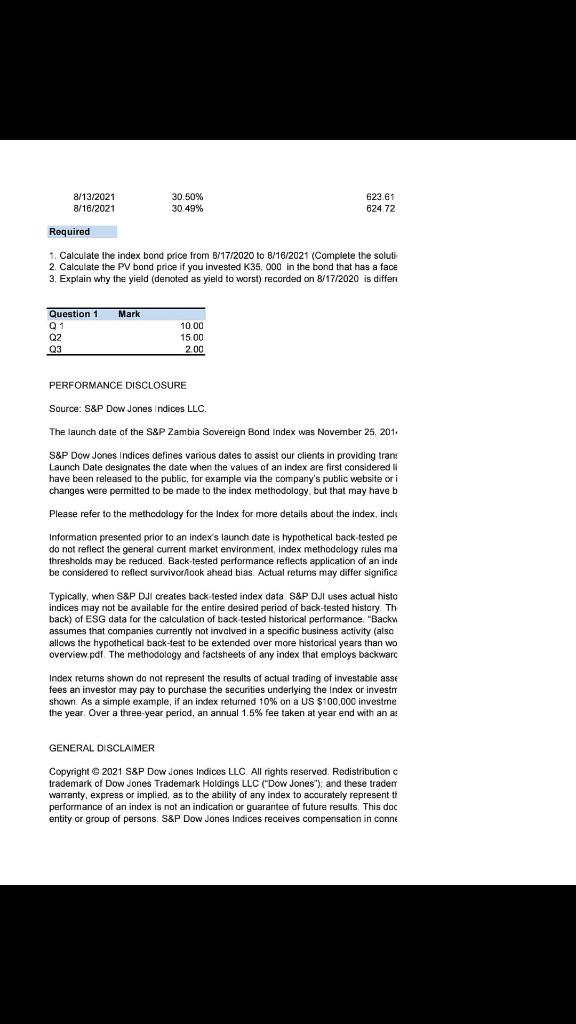
S&P Dow Jones Indices A Division of AP Globa Index Name: S&P Zambia Sovereign Bond Index As of Aug 16, 2021 1 year bond https://www.spglobal comispdifervindices/fixed-income/sp-zambia-sovereign-bond- Effective date Yield To Worst Index Return in Kwacha ( 1 year bond) 8/17/2020 30.71% 460 64 8/18/2020 30.71% 461 8/19/2020 30.71% 461.64 8/20/2020 30.71% 462 8/21/2020 31 36% 458 46 8/24/2020 31 36% 459 21 8/25/2020 31.36% 459.54 8/26/2020 31.36% 460.19 8/27/2020 31.36% 460 56 8/28/2020 31.36% 460.98 8/31/2020 30.94% 464.38 9/1/2020 31.04% 464.74 9/2/2020 31.04% 465 37 9/3/2020 31.03% 465.73 9/4/2020 31.03% 460 08 9/7/2020 31.03% 466.9 9/8/2020 31.03% 467 26 9/9/2020 31.03% 467.9 9/10/2020 31.03% 468 26 9/11/2020 31.03% 468.63 9/14/2020 31.03% 469 44 9/15/2020 31.03% 469 81 9/16/2020 31.03% 470.45 9/17/2020 31.03% 470.82 9/18/2020 31.03% 471.19 9/21/2020 31.03% 472 02 9/22/2020 32.33% 463.42 9/23/2020 32.33% 464.09 9/24/2020 32 33% 464 46 9/25/2020 32.33% 464.84 9/28/2020 32.33% 465 66 9/29/2020 32 33% 466 04 9/30/2020 31 71% 469 24 10/1/2020 31.72% 469.62 10/2/2020 31.72% 470 10/5/2020 31.72% 470.84 10/6/2020 31.72% 471 22 10/7/2020 31.72% 471.9 10/8/2020 31.72% 472 28 10/9/2020 31.72% 472 66 10/12/2020 31.72% 473.5 8/13/2021 8/16/2021 30.50% 30.49% 623 61 624 72 Required 1. Calculate the index bond price from B/17/2020 to 8/16/2021 (Complete the soluti 2. Calculate the PV bond price if you invested K35,000 in the bond that has a face 3. Explain why the yield (denoted as yield to worst) recorded on 8/17/2020 is differ Mark Question 1 Q1 Q2 Q3 10.00 15.00 200 PERFORMANCE DISCLOSURE Source: S&P Dow Jones Indices LLC. The launch date of the S&P Zambia Sovereign Bond Index was November 25, 201. S&P Dow Jones Indices defines various dates to assist our clients in providing trans Launch Date designates the date when the values of an index are first considered have been released to the public, for example via the company's public website or i changes were permitted to be made to the index methodology, but that may have b Please refer to the methodology for the Index for more details about the index, inch Information presented prior to an index's launch date is hypothetical back-tested pe do not reflect the general current market environment, index methodology rules ma thresholds may be reduced. Back-tested performance reflects application of an inde be considered to reflect survivor/look ahead bias. Actual returns may differ significa Typically, when S&P DJI creates back tested index data S&P DJ uses actual histo indices may not be available for the entire desired period of back-tested history Th back) of ESG data for the calculation of back-tested historical performance. "Backu assumes that companies currently not involved in a specific business activity (also allows the hypothetical back-test to be extended over more historical years than wo overview.pdf The methodology and factsheets of any index that employs backwarc Index returns shown do not represent the results of actual trading of investable asse fees an investor may pay to purchase the securities underlying the Index or invest shown. As a simple example, if an index returned 10% on a US $100.000 investme the year. Over a three year period, an annual 1.5% fee taken at year end with an a: GENERAL DISCLAIMER Copyright 2021 S&P Dow Jones Indices LLC. All rights reserved. Redistribution c trademark of Dow Jones Trademark Holdings LLC ("Dow Jones"), and these trader warranty, express or implied, as to the ability of any index to accurately represent tt performance of an index is not an indication or guarantee of future results. This doc entity or group of persons. S&P Dow Jones Indices receives compensation in conne S&P Dow Jones Indices A Division of AP Globa Index Name: S&P Zambia Sovereign Bond Index As of Aug 16, 2021 1 year bond https://www.spglobal comispdifervindices/fixed-income/sp-zambia-sovereign-bond- Effective date Yield To Worst Index Return in Kwacha ( 1 year bond) 8/17/2020 30.71% 460 64 8/18/2020 30.71% 461 8/19/2020 30.71% 461.64 8/20/2020 30.71% 462 8/21/2020 31 36% 458 46 8/24/2020 31 36% 459 21 8/25/2020 31.36% 459.54 8/26/2020 31.36% 460.19 8/27/2020 31.36% 460 56 8/28/2020 31.36% 460.98 8/31/2020 30.94% 464.38 9/1/2020 31.04% 464.74 9/2/2020 31.04% 465 37 9/3/2020 31.03% 465.73 9/4/2020 31.03% 460 08 9/7/2020 31.03% 466.9 9/8/2020 31.03% 467 26 9/9/2020 31.03% 467.9 9/10/2020 31.03% 468 26 9/11/2020 31.03% 468.63 9/14/2020 31.03% 469 44 9/15/2020 31.03% 469 81 9/16/2020 31.03% 470.45 9/17/2020 31.03% 470.82 9/18/2020 31.03% 471.19 9/21/2020 31.03% 472 02 9/22/2020 32.33% 463.42 9/23/2020 32.33% 464.09 9/24/2020 32 33% 464 46 9/25/2020 32.33% 464.84 9/28/2020 32.33% 465 66 9/29/2020 32 33% 466 04 9/30/2020 31 71% 469 24 10/1/2020 31.72% 469.62 10/2/2020 31.72% 470 10/5/2020 31.72% 470.84 10/6/2020 31.72% 471 22 10/7/2020 31.72% 471.9 10/8/2020 31.72% 472 28 10/9/2020 31.72% 472 66 10/12/2020 31.72% 473.5 8/13/2021 8/16/2021 30.50% 30.49% 623 61 624 72 Required 1. Calculate the index bond price from B/17/2020 to 8/16/2021 (Complete the soluti 2. Calculate the PV bond price if you invested K35,000 in the bond that has a face 3. Explain why the yield (denoted as yield to worst) recorded on 8/17/2020 is differ Mark Question 1 Q1 Q2 Q3 10.00 15.00 200 PERFORMANCE DISCLOSURE Source: S&P Dow Jones Indices LLC. The launch date of the S&P Zambia Sovereign Bond Index was November 25, 201. S&P Dow Jones Indices defines various dates to assist our clients in providing trans Launch Date designates the date when the values of an index are first considered have been released to the public, for example via the company's public website or i changes were permitted to be made to the index methodology, but that may have b Please refer to the methodology for the Index for more details about the index, inch Information presented prior to an index's launch date is hypothetical back-tested pe do not reflect the general current market environment, index methodology rules ma thresholds may be reduced. Back-tested performance reflects application of an inde be considered to reflect survivor/look ahead bias. Actual returns may differ significa Typically, when S&P DJI creates back tested index data S&P DJ uses actual histo indices may not be available for the entire desired period of back-tested history Th back) of ESG data for the calculation of back-tested historical performance. "Backu assumes that companies currently not involved in a specific business activity (also allows the hypothetical back-test to be extended over more historical years than wo overview.pdf The methodology and factsheets of any index that employs backwarc Index returns shown do not represent the results of actual trading of investable asse fees an investor may pay to purchase the securities underlying the Index or invest shown. As a simple example, if an index returned 10% on a US $100.000 investme the year. Over a three year period, an annual 1.5% fee taken at year end with an a: GENERAL DISCLAIMER Copyright 2021 S&P Dow Jones Indices LLC. All rights reserved. Redistribution c trademark of Dow Jones Trademark Holdings LLC ("Dow Jones"), and these trader warranty, express or implied, as to the ability of any index to accurately represent tt performance of an index is not an indication or guarantee of future results. This doc entity or group of persons. S&P Dow Jones Indices receives compensation in conne