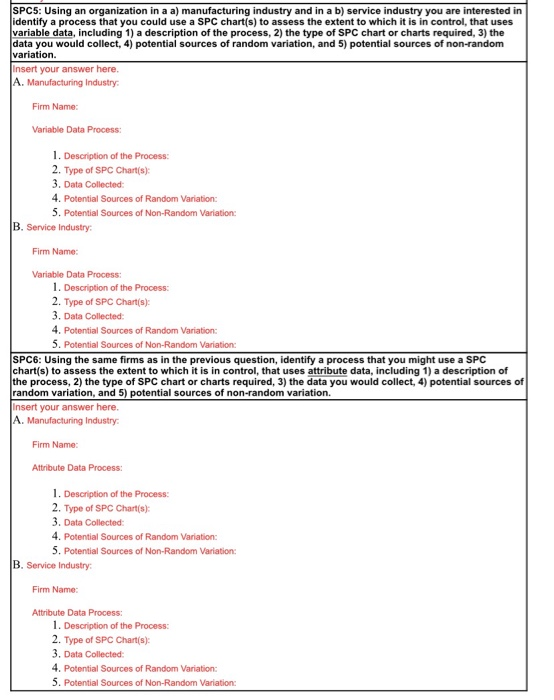
SPC5: Using an organization in a a) manufacturing industry and in a b) service industry you are interested in identify a process that you could use a SPC chart(s) to assess the extent to which it is in control, that uses variable data, including 1) a description of the process, 2) the type of SPC chart or charts required, 3) the data you would collect, 4) potential sources of random variation, and 5) potential sources of non-random variation. Insert your answer here, A. Manufacturing Industry Firm Name: Variable Data Process: 1. Description of the Process: 2. Type of SPC Chart(s) 3. Data Collected 4. Potential Sources of Random Variation: 5. Potential Sources of Non-Random Variation: B. Service Industry Firm Name: Variable Data Process: 1. Description of the Process: 2. Type of SPC Chart(s) 3. Data Collected 4. Potential Sources of Random Variation: 5. Potential Sources of Non-Random Variation: SPC6: Using the same firms as in the previous question, identify a process that you might use a SPC chart(s) to assess the extent to which it is in control, that uses attribute data, including 1) a description of the process, 2) the type of SPC chart or charts required, 3) the data you would collect, 4) potential sources of random variation, and 5) potential sources of non-random variation. insert your answer here. A. Manufacturing Industry Firm Name: Attribute Data Process: 1. Description of the Process: 2. Type of SPC Chart(s): 3. Data Collected 4. Potential Sources of Random Variation: 5. Potential Sources of Non-Random Variation: B. Service Industry: Firm Name: Attribute Data Process: 1. Description of the Process: 2. Type of SPC Chart(s) 3. Data Collected: 4. Potential Sources of Random Variation: 5. Potential Sources of Non-Random Variation: SPC5: Using an organization in a a) manufacturing industry and in a b) service industry you are interested in identify a process that you could use a SPC chart(s) to assess the extent to which it is in control, that uses variable data, including 1) a description of the process, 2) the type of SPC chart or charts required, 3) the data you would collect, 4) potential sources of random variation, and 5) potential sources of non-random variation. Insert your answer here, A. Manufacturing Industry Firm Name: Variable Data Process: 1. Description of the Process: 2. Type of SPC Chart(s) 3. Data Collected 4. Potential Sources of Random Variation: 5. Potential Sources of Non-Random Variation: B. Service Industry Firm Name: Variable Data Process: 1. Description of the Process: 2. Type of SPC Chart(s) 3. Data Collected 4. Potential Sources of Random Variation: 5. Potential Sources of Non-Random Variation: SPC6: Using the same firms as in the previous question, identify a process that you might use a SPC chart(s) to assess the extent to which it is in control, that uses attribute data, including 1) a description of the process, 2) the type of SPC chart or charts required, 3) the data you would collect, 4) potential sources of random variation, and 5) potential sources of non-random variation. insert your answer here. A. Manufacturing Industry Firm Name: Attribute Data Process: 1. Description of the Process: 2. Type of SPC Chart(s): 3. Data Collected 4. Potential Sources of Random Variation: 5. Potential Sources of Non-Random Variation: B. Service Industry: Firm Name: Attribute Data Process: 1. Description of the Process: 2. Type of SPC Chart(s) 3. Data Collected: 4. Potential Sources of Random Variation: 5. Potential Sources of Non-Random Variation


