Answered step by step
Verified Expert Solution
Question
1 Approved Answer
Specifically, you must address the following rubric criteria: Fiscal Quarter Comparison. Summarize the differences between the following: The results from your financial calculations of the
Specifically, you must address the following rubric criteria:
- Fiscal Quarter Comparison. Summarize the differences between the following:
- The results from your financial calculations of the most recent fiscal quarter
- The results of the same financial calculations of the same fiscal quarter from one year ago
- Comparison Analysis. Explain what your calculations and comparison show about the businesss current financial health. Give examples to support your explanation for the following questions:
- Do the results show the business is financially healthy or unhealthy? Which results indicate this?
- What might be the causes of the businesss financial success or failure?
- Is more information needed to determine the businesss financial health? If so, which pieces of information might still be needed?
- Short-Term Financing. Explain how potential short-term financing sources could help the business raise funds needed to improve its financial health. Base your response on the businesss current financial information.
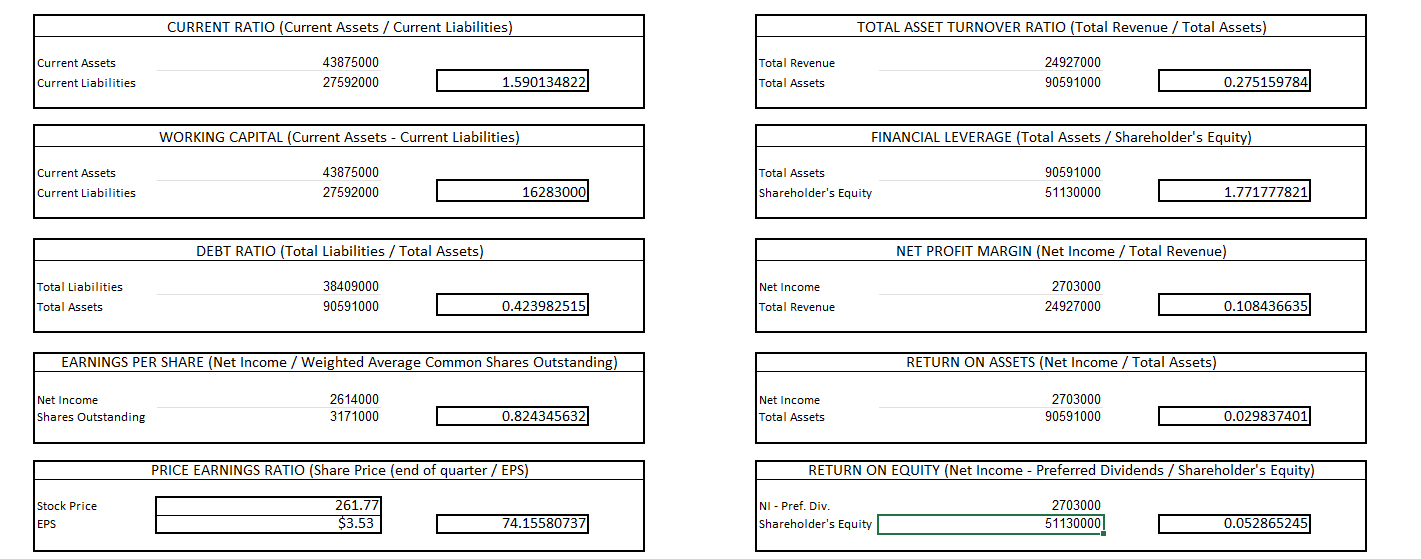
Current Year

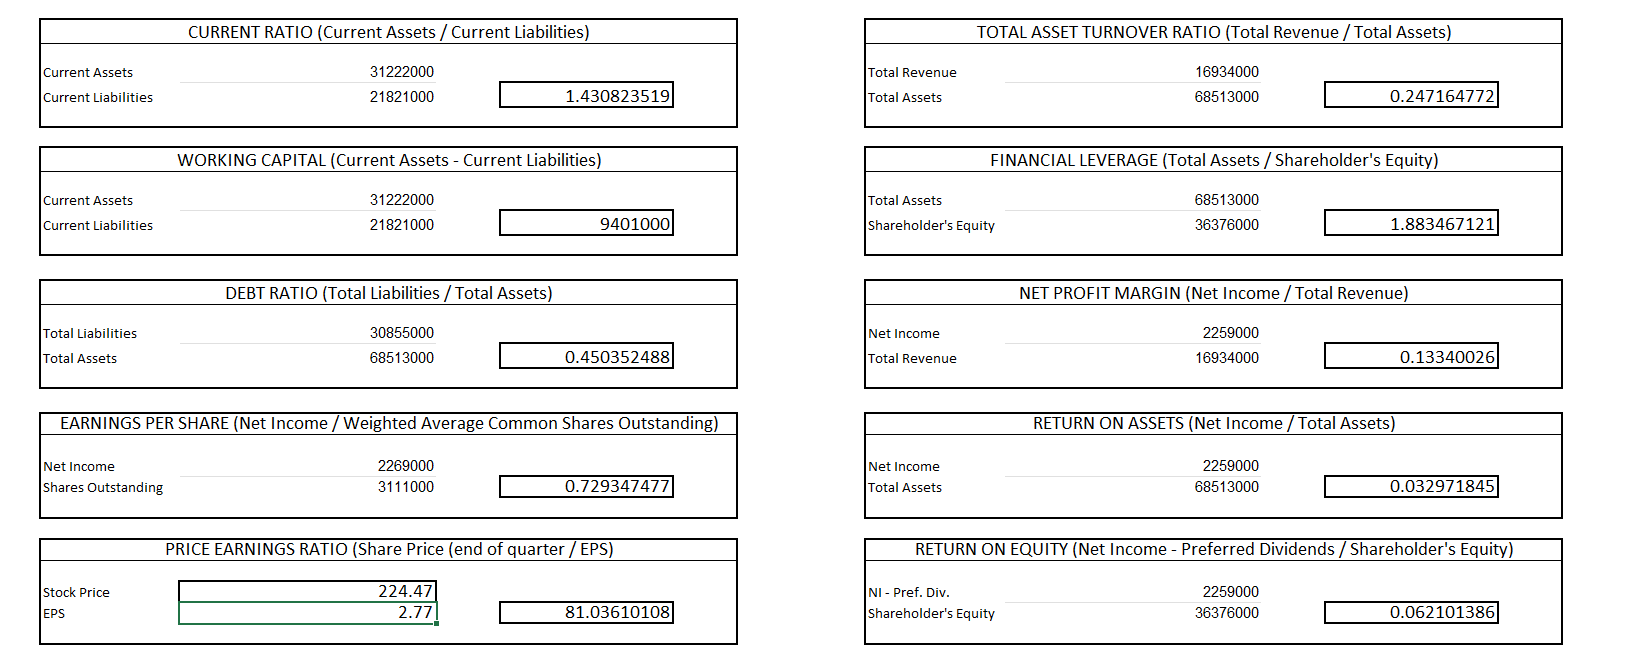
1 Year Ago
 \begin{tabular}{|lrr|} \hline & \multicolumn{2}{c|}{ CURRENT RATIO (Current Assets / Current Liabilities) } \\ \hline & & \\ Current Assets & 43875000 & \\ Current Liabilities & 27592000 & 1.590134822 \\ \hline \end{tabular} \begin{tabular}{|lrr|} \hline \multicolumn{3}{|c|}{ WORKING CAPITAL (Current Assets - Current Liabilities) } \\ \hline \multirow{3}{*}{CurrentAssetsCurrentLiabilities} & 43875000 & \\ & 27592000 & 16283000 \\ \hline \end{tabular} \begin{tabular}{|lcr|} \hline & DEBT RATIO (Total Liabilities / Total Assets) \\ \hline Total Liabilities & 38409000 & \\ Total Assets & 90591000 & \\ & & 0.423982515 \\ \hline \end{tabular} \begin{tabular}{|c|c|c|} \hline \multicolumn{3}{|c|}{ EARNINGS PER SHARE (Net Income / Weighted Average Common Shares Outstanding) } \\ \hline Net Income & 2614000 & \\ \hline Shares Outstanding & 3171000 & 0.824345632 \\ \hline \multicolumn{3}{|c|}{ PRICE EARNINGS RATIO (Share Price (end of quarter / EPS) } \\ \hline Stock Price & 261.77 & \\ \hline EPS & $3.53 & 74.15580737 \\ \hline \end{tabular} \begin{tabular}{|lrr|} \hline & TOTAL ASSET TURNOVER RATIO (Total Revenue / Total Assets) \\ \hline Total Revenue & 24927000 & \\ Total Assets & 90591000 & 0.275159784 \\ \hline \end{tabular} \begin{tabular}{|lcr|} \hline \multicolumn{3}{|c|}{ FINANCIAL LEVERAGE (Total Assets / Shareholder's Equity) } \\ \hline \multirow{2}{*}{TotalAssetsShareholdersEquity} & 90591000 \\ & 51130000 & 1.771777821 \\ \hline \end{tabular} \begin{tabular}{|lrr|} \hline & NET PROFIT MARGIN (Net Income / Total Revenue) \\ \hline Net Income & 2703000 & \\ Total Revenue & 24927000 & 0.108436635 \\ \hline \end{tabular} \begin{tabular}{|lrr|} \hline & RETURN ON ASSETS (Net Income / Total Assets) \\ \hline & 2703000 & \\ Net Income & 90591000 & 0.029837401 \\ \hline Total Assets & & \\ & & \\ \hline \end{tabular} \begin{tabular}{|l|r|} \hline \multicolumn{2}{|c|}{ RETURN ON EQUITY (Net Income - Preferred Dividends / Shareholder's Equity) } \\ \hline \multirow{2}{*}{ NI - Pref. Div. } \\ Shareholder's Equity \end{tabular} \begin{tabular}{|lrr|} \hline \multicolumn{3}{|c|}{ CURRENT RATIO (Current Assets / Current Liabilities) } \\ \hline Current Assets & 31222000 & \\ Current Liabilities & 21821000 & 1.430823519 \\ \hline \end{tabular} \begin{tabular}{|lcr|} \hline \multicolumn{3}{|c|}{ WORKING CAPITAL (Current Assets - Current Liabilities) } \\ \hline Current Assets & 31222000 & \\ \cline { 2 - 2 } Current Liabilities & 21821000 & 9401000 \\ \hline \end{tabular} \begin{tabular}{|lrr|} \hline \multicolumn{3}{|c|}{ DEBT RATIO (Total Liabilities / Total Assets) } \\ \hline Total Liabilities & 30855000 & \\ Total Assets & 68513000 & 0.450352488 \\ \hline \end{tabular} \begin{tabular}{|lcr|} \hline \multicolumn{3}{|c|}{ TOTAL ASSET TURNOVER RATIO (Total Revenue / Total Assets) } \\ \hline Total Revenue & 16934000 & \\ Total Assets & 68513000 & 0.247164772 \\ \hline \end{tabular} \begin{tabular}{|lcr|} \hline \multicolumn{3}{|c|}{ FINANCIAL LEVERAGE (Total Assets / Shareholder's Equity) } \\ \hline Total Assets & 68513000 & \\ Shareholder's Equity & 36376000 & 1.883467121 \\ \hline \end{tabular} \begin{tabular}{|lrr|} \hline \multicolumn{3}{|c|}{ NET PROFIT MARGIN (Net Income / Total Revenue) } \\ \hline Net Income & 2259000 & \\ Total Revenue & 16934000 & 0.13340026 \\ \hline \end{tabular} \begin{tabular}{|lrr|} \hline \multicolumn{3}{c|}{ RETURN ON ASSETS (Net Income / Total Assets) } \\ \hline Net Income & 2259000 & \\ Total Assets & 68513000 & 0.032971845 \\ & & \\ \hline \end{tabular} \begin{tabular}{|lrr|} \hline \multicolumn{2}{|c|}{ RETURN ON EQUITY (Net Income - Preferred Dividends / Shareholder's Equity) } \\ \hline \multirow{2}{*}{N1-Pref.Div.ShareholdersEquity} & 2259000 & \\ & 36376000 & 0.062101386 \\ \hline \end{tabular}
 Step by Step Solution
There are 3 Steps involved in it
Step: 1

Get Instant Access to Expert-Tailored Solutions
See step-by-step solutions with expert insights and AI powered tools for academic success
Step: 2

Step: 3

Ace Your Homework with AI
Get the answers you need in no time with our AI-driven, step-by-step assistance
Get Started


