Answered step by step
Verified Expert Solution
Link Copied!

Question

1 Approved Answer

Speedy Automotive It is August 2018 and Speedy Automotive is one of four car dealerships located in rural Ontario. The residents in the area replace

Speedy Automotive

It is August 2018 and Speedy Automotive is one of four car dealerships located in

rural Ontario. The residents in the area replace their vehicles roughly every eight

years. When they do replace their vehicles, they tend to visit the same dealership

that sold them the first one, building a relationship with the dealership. This has

kept sales relatively stable for all the dealerships in the area. Recently, however,

customers have begun expanding their shopping options. Speedy Automotive

believes this is due to the rise of the Internet. Customers have begun coming to the

dealership with an exact idea of what car they would like and have a price in mind.

When Speedy Automotive does not have the model available or cannot meet the

price, customers have started going to competitors.

This trend has the general manager of Speedy, Mike Leavy, worried. Mike runs the

dealership like a small business and relies on repeat customers. Speedy is not a

chain and has little access to outside capital, so cash flow is critical. If sales are low,

Mike has to take out a loan to pay the manufacturer for the vehicles. If sales are

high, Speedy might lose potential customers due to a lack of inventory. Mike has

decided that he needs to be able to forecast this new variability to keep the

business healthy.

Barb Goodson is the inventory manager at Speedy and has historically prepared the

forecasts. Barb usually just takes the sales numbers from last year and adjusts them

upward or downward based on her gut feeling. This has worked in the past, but

Mike has told her to look into other forecasting methods. Barb is preparing the

September 2018 sales forecast for Speedy and is not sure where to start. For the

August forecast, Barb used the sales numbers from August 2017. The August 2017

forecast was off by 6 cars and Barb hoped the 2018 version would fare better. She

assumed the sales representatives would always work a little harder if sales were

low and they could always take vacation time if they were above target.

Mike has told Barb to look into various Time Series and select the best option, but

Barb is not sure what they are. Mike also wants Barb to determine the amount of

profit actually being lost due to poor forecasting and potentially being lost. Barb

has access to sales and forecast data from the past 18 months and has already

calculated various measures of error in Excel.
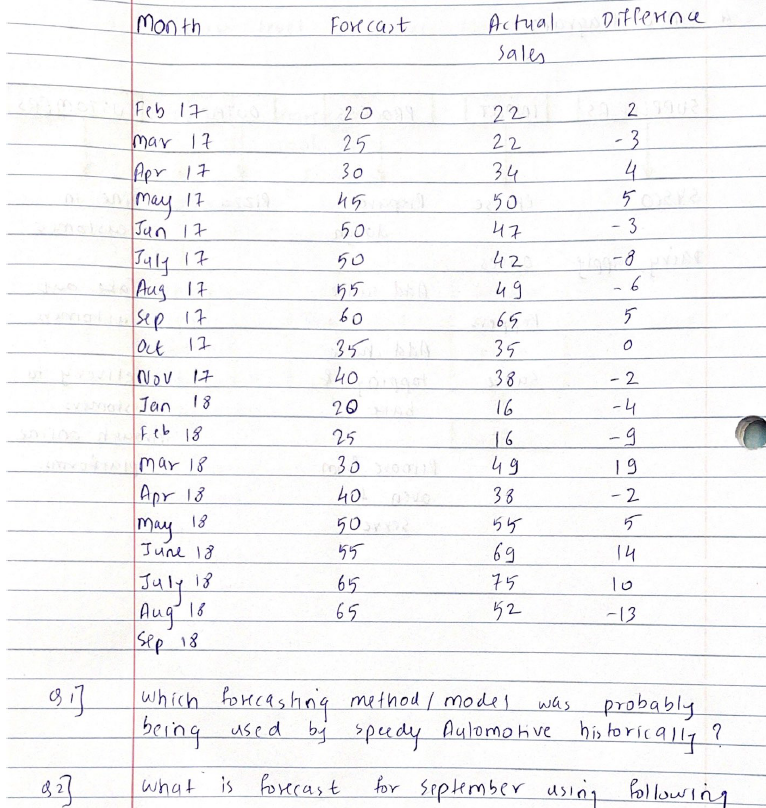
image text in transcribedimage text in transcribed

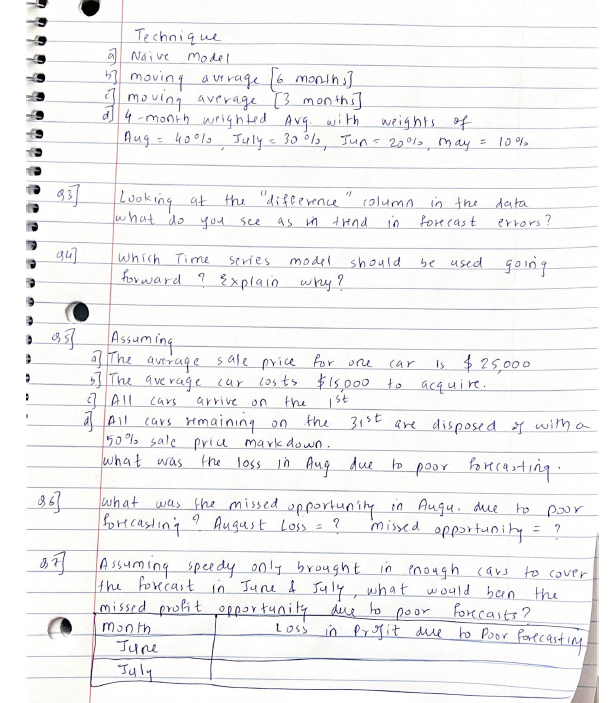
month Forecast Diflenna Actual sales Feb 17 2 mar 17 Apr 17 a may 17 Jun 17 3 4 5 - 3 20 25 30 45 50 50 55 60 35 40 July 17 -8 - -6 0 22 22 34 so 47 42 49 65 35 38 16 16 49 38 55 69 75 52 Aug 17 Sep 17 lout 12 NOV 17 Jan 18 Ifeb 18 mar 18 Apr 18 -2 -4 -9 19 - 2 20 25 30 sout 40 50 55 65 65 May 18 14 June 18 18 July Aug 18 -13 Sep 18 was which forecasting method / modes probably being used by speedy Aulomotive historically ? is forecast for september using following de what Technique a Naive model 17 moving average [6 months) of moving average (3 months] d) 4-month weighted Avg. with weights of Aug = 400% July 30% Jun 20% may s TO 93] Looking at the difference " column in the what do you see as in trend in forecast data errors? 94] which Time series model should forward ? Explain why? be used going (ar Cars 1 00 as] Assuming a] The average sale price for one Is $ 25000 6] The average car costs $15,000 to acquire. AI1 arrive on the st cars remaining the 31st are disposed of with a 50% sale price markdown. what was the loss in Aug due to poor forecasting. &6] what was the missed opportunity in Augu. due to por forecasting August Loss = ? missed opportunity 37] Assuming speedy only brought in enough cars to cover the forecast in June & July , what would ben. the missed profit opportunity due to Door forecasts? month Loss in Profit due to poor forecasting June July 2 month Forecast Diflenna Actual sales Feb 17 2 mar 17 Apr 17 a may 17 Jun 17 3 4 5 - 3 20 25 30 45 50 50 55 60 35 40 July 17 -8 - -6 0 22 22 34 so 47 42 49 65 35 38 16 16 49 38 55 69 75 52 Aug 17 Sep 17 lout 12 NOV 17 Jan 18 Ifeb 18 mar 18 Apr 18 -2 -4 -9 19 - 2 20 25 30 sout 40 50 55 65 65 May 18 14 June 18 18 July Aug 18 -13 Sep 18 was which forecasting method / modes probably being used by speedy Aulomotive historically ? is forecast for september using following de what Technique a Naive model 17 moving average [6 months) of moving average (3 months] d) 4-month weighted Avg. with weights of Aug = 400% July 30% Jun 20% may s TO 93] Looking at the difference " column in the what do you see as in trend in forecast data errors? 94] which Time series model should forward ? Explain why? be used going (ar Cars 1 00 as] Assuming a] The average sale price for one Is $ 25000 6] The average car costs $15,000 to acquire. AI1 arrive on the st cars remaining the 31st are disposed of with a 50% sale price markdown. what was the loss in Aug due to poor forecasting. &6] what was the missed opportunity in Augu. due to por forecasting August Loss = ? missed opportunity 37] Assuming speedy only brought in enough cars to cover the forecast in June & July , what would ben. the missed profit opportunity due to Door forecasts? month Loss in Profit due to poor forecasting June July 2

Step by Step Solution

There are 3 Steps involved in it

Step: 1

blur-text-image

Get Instant Access to Expert-Tailored Solutions

See step-by-step solutions with expert insights and AI powered tools for academic success

Step: 2

blur-text-image_2

Step: 3

blur-text-image_3

Ace Your Homework with AI

Get the answers you need in no time with our AI-driven, step-by-step assistance

Get Started

Recommended Textbook for

Financial Accounting A Focus On Interpretation And Analysis

Authors: Richard F Kochanek, A Douglas Hillman

7th Edition

1111061750, 9781111061753

More Books

Students also viewed these Finance questions