Question: Spend analysis Stock-keeping unit (SKU) 10 Three-way match Utilization ty Images; @ monsity/ Getty Images Vendor master health care? iency? CHAPTER 17 applied, and what
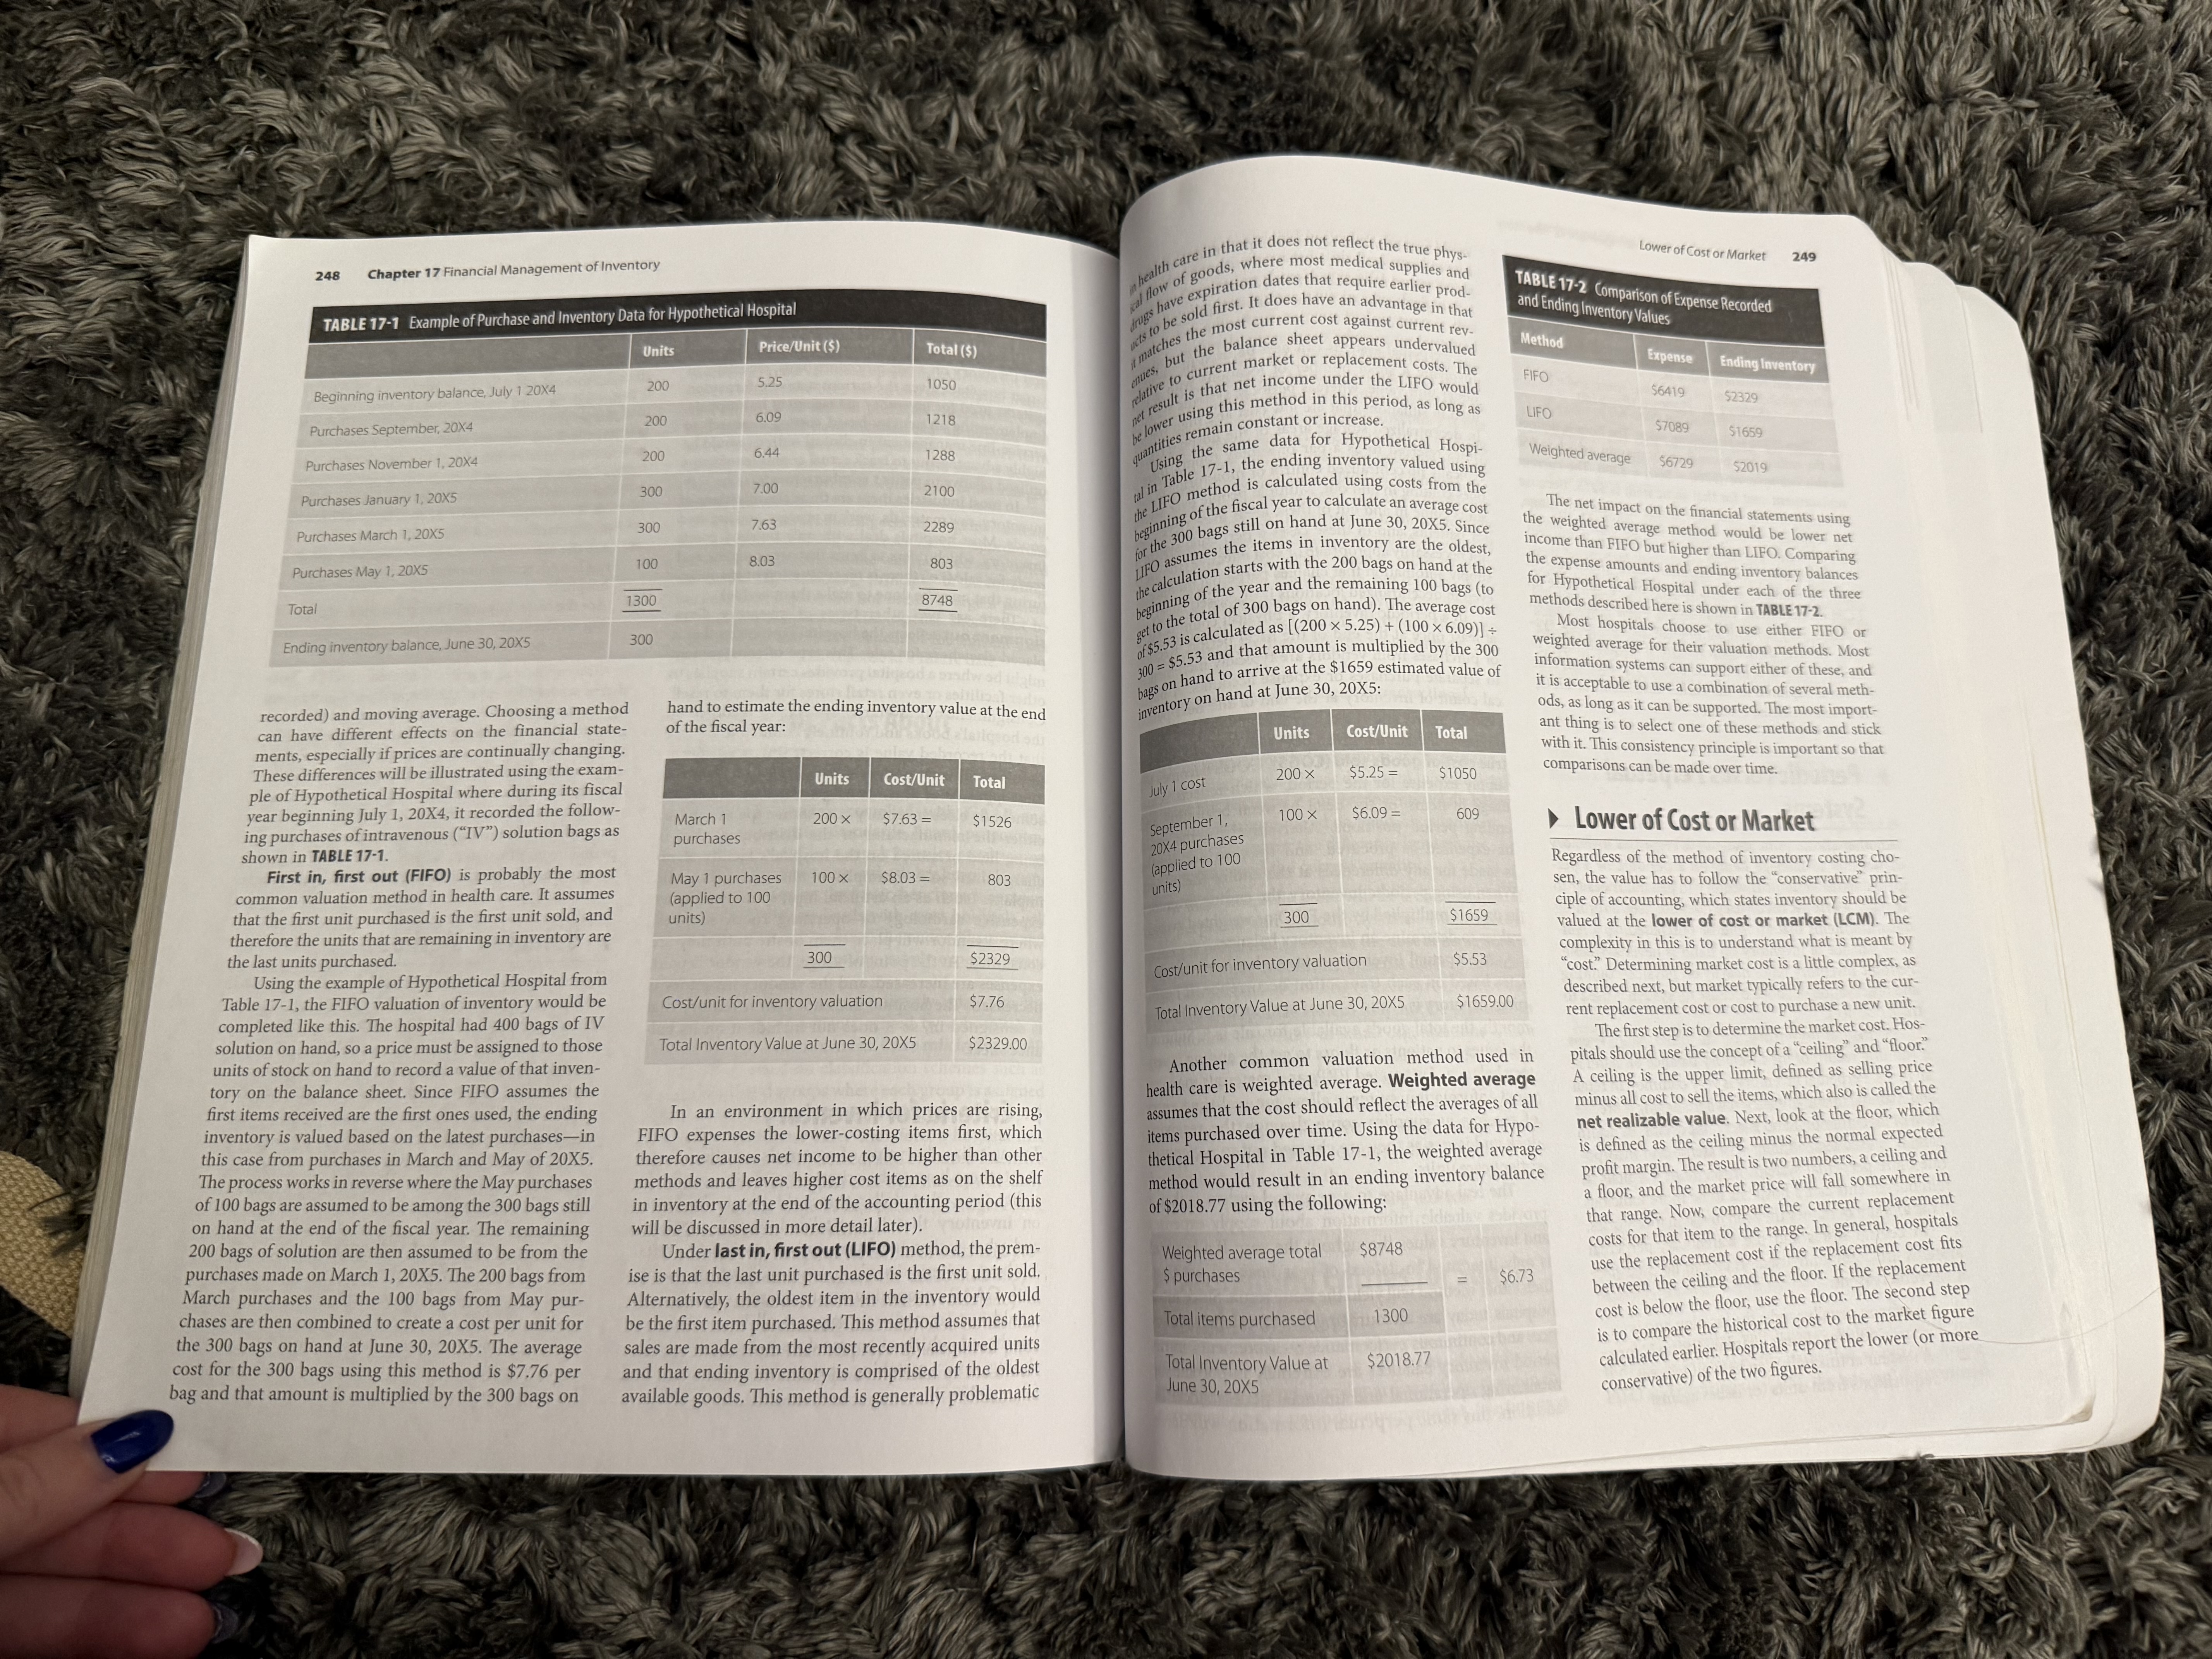
Spend analysis Stock-keeping unit (SKU) 10 Three-way match Utilization ty Images; @ monsity/ Getty Images Vendor master health care? iency? CHAPTER 17 applied, and what are the steps to fol- financial Management ties. Retrieved from https://www.cdc.gov of Inventory wrhtml/rr5210al.htm , & Billington, C. (2004). Understanding services supply chain. Journal of Supply 40, 17-32. 004). Operations Management (7th ed.). GOALS OF THIS CHAPTER Prentice Hall. Define inventory. 2. Understand the pros and cons of maintaining inventory. 3. Understand the difference between perpetual and periodic methods. 4. Explain common accounting entries for inventory management. 5. Calculate common inventory ratios. nventory is a complicated subject in most indus- tries, and it is even less understood in health care. Inventory and Its Role Inventory represents acquisition and storage of materials that will not be consumed today (and thus in Health Care have some value in the future) and that will be used Inventory can be defined from an accounting or an within the normal operating cycle. It is therefore operations perspective. From an accounting defini- treated financially as a current asset, and proper treat- tion, inventory includes those assets that are used to ment requires capitalizing it and recording a value on generate revenue and that will be converted to cash the balance sheet. in the short term. They are assets (e.g., supplies) that However, in most hospitals, inventory is geo- are held for sale. In the case of hospitals, medical sup- graphically dispersed and of relatively small financia plies and pharmaceuticals are directly or indirectly value in disaggregated form (i.e., hospital inventory charged back to patients-through direct charges usually sits in treatment and exam rooms, surgical through healthcare common procedure coding sys- suites, and supply closets). When aggregated, how- tem (HCPCS) or other procedural charges-or they ever, these supplies can represent millions or even tens are reimbursed as part of per diem, diagnosis-related of millions of dollars for most hospitals. This chapter group (DRG), room, or other service procedure codes. discusses the basics of inventory accounting and man- This depends on the specific hospital, the types of ser- agement in health care. vices they typically receive reimbursement for, and theDifferences Between Supply Expense and Inventory 245 244 Chapter 17 Financial Management of Inventory specific payer mix. Regardless, most medical supplies Inventory hedges against price changes. If a upplies 2 weeks earlier than they were needed , at a SUPPost of capital or interest forfeited that could have values (generally accepted accounting principles reimbursed either directly or indirectly , and drugs are reimbursed e supply cost is increasing at a creasing at a greater rate than sen invested elsewhere, the hospital forfeited $1923 [GAAP] represents the accounting principles required and therefore they represent costs incurred that will the average consumer price inflation of 3%, it breecessarily. This loss is calculated as $1,000,000 deliver future benefits. is sometimes beneficial to hold larger volumes of inventory as a hedge against the risk of rising "hid x 5% cost of capital x (2 weeks early / 52 weeks in for use by public companies ) , there is little consistency year ) = $1923. Also important in this case of the lost in how supplies are expensed and inventory is capi- From an operations perspective, inventory rep - talized . A few findings from this author's resents a margin of safety to protect the business from prices. i've of investable cash is that this calculation does not rumors research of published hospital annual reports and Medicare cost unpredictable levels of demand . Without inventory , Inventory allows purchasing to take place under include the additional holding cost of inventory (i.e., reports for nonprofits suggest that these account practices are not used hospitals could purchase just enough products to sus - most favorable price terms. tain normal operations , but if one more incremental Inventory protects against uncertainties in cost of storage and handling of the items while at the instance, most publish in most cases. For demand and lead times for receipt of ordered ancials for hospitals tend unit was used or consumed , then the entire supply tospital). chain would be thrown in chaos with not having sup - of course, this is not always possible, as discussed to show a very small inventory balance and lump sup- goods. ply expenses under a large group called operational plies needed to provide services (known as "stock- Inventory helps accurately report financial arlier. But from a cash flow perspective, the timing expenses. Very little detail below this aggregated value outs"), reduced service levels, and a potential inability results, since the timing of the supply expense of the receipt and payment of goods should be as to fully treat a patient. In operations terms, inventory must be associated with the period in which late as possible to allow cash to be invested in other is publicly available. Where the data are available, they is a buffer against demand variability. revenues are generated. If material is on hand higher-returning areas, such as new buildings, invest- are inconsistent with actual practice and should be approached with caution. Operationally, inventory serves a multitude of but not actually used and patients have not been nents, or other capital programs. other functions: charged, then it is proper not to record payment Another reason not to hold inventories is they The best way to understand the true costs of inven- tory and supplies, in an environment that is probably Inventory improves customer service by making for those items as an expense. Therefore, inven- ften hide problems. Inventory serves as a buffer, more cost-conscious and that is required to use GAAP products available immediately. tory serves a valuable purpose in the accurate and as such, operational problems that exist might go accounting, is to examine the publicly traded, for- statement of operations. Inventory allows for economies of scale, as it unnoticed for many periods. For example, if a nurs- profit hospital systems. Examining the inventory bal- encourages aggregation of production, purchase, Inventory protects against demand volatility. ing unit forgets to accurately record supply usage or ances of several of the largest for-profit hospital chains and transportation to achieve reduced costs. When demand is less than certain, or variable, administration against a patient's medical records in a shows the following patterns: Inventory allows for batching of orders, which inventory helps protect against this variability . timely manner, then there could be potential for lost For instance, if 100 packs of bandages are used charges. If hospitals do not build inventory, it is much Average inventory for medium-size hospitals is creates economies of scale for purchasing. Larger around $3 million-$4 million per hospital. orders usually are associated with pricing dis- fairly consistently, but a large incident might easier to discover this omission. Otherwise, days' or counts. Also batching allows staff doing pur- create demand for another 50, inventory would Inventory represents approximately 5%-15% of weeks' worth of inventory sits onsite and might only current assets. chasing to process fewer total transactions, thus help provide some measure of protection or be discovered during periodic physical counts of Investments in inventory constitute about reducing costs for the purchasing function. margin of safety to keep operations running inventory on hand (known as "cycle counts"). Also, 2%-4% of total assets and net revenues. Inventory takes advantage of pricing discounts for when demand levels and lead times cannot be n systems that are not working properly, lower utiliza Inventory represents the largest portion of work- large quantities. For most manufacturers and dis- known for sure. tion rates, slow cycle times, and otherwise unproduc- ing capital requirements. tributors, it is significantly easier to work in larger Inventory provides buffers against tragic events tive processes are often masked by inventory . volumes or batches than in smaller quantities (e.g., and other disruptions in supply. When the major The bottom line is that inventories are a signifi- cant investment for hospitals and should be treated "each" or individual items). Because manufactur hurricanes of 2005 hit the Gulf Coast of the ers produce in large batches to reduce production United States, supply lines were essentially cut off The Costs of Supplies accordingly. costs, and distributors receive quantity discounts completely-highways were jammed and many for buying in volume, they are often able to pass vendors and distributors were closed down. In and Inventory significant savings on to hospitals if they can pur- the event that a hospital was forced to continue Differences Between Supply chase in larger volumes. Unfortunately, many hos- operations, it likely did so because of inventories The supply chain represents over 30% of all hospital Expense and Inventory pitals have very little warehouse or storage space that were built up prior to the storm. operating costs, second only to labor. Pharmaceu ticals and other medical supplies represent at least So what is the difference between supply and inven- and have to work on a just-in-time (JIT) basis. Thus, there are many positive reasons a hospital 10% of that figure. This makes it extremely important tory, and is there really a distinction between the Inventory allows for transport economies from would want to hold inventory, but there are also some to understand the financial management aspects of two? The answer is yes-but the distinction can be larger shipment sizes. Smaller orders have a very negative and financial reasons not to do so. The biggest inventory. In smaller organizations, supply costs can described in just two words: timing and chargeable. high transportation cost, especially relative to the reason not to hold excessive inventories is that they range from $3.2 million for a hospital with a $25 mil- Timing represents the difference between when unit cost. For example, assume a $2 surgical pro- consume cash and capital resources that might be put lion annual expense budget to $170 million for a $1 a supply is purchased and when it is consumed. If it cedure kit was ordered and shipped with trans- to better use elsewhere. Inventories represent prepaid billion organization. Add the costs of materials man- is purchased and consumed in the same period, it is portation costs of $3 minimum for overnight agement departments, the salaries of technicians and treated as a supply expense and is presented on the delivery. The transportation cost, then, is 150% supplies-cash spent on supplies that once spent can- not be used for other purposes. If a hospital does not nursing staff who touch supplies, warehouse and other ncome statement with all other expenses. So, if $1000 of the product cost. Assume 10 items could be facility expenses, the cost of systems time, and, finally, of suture packages were purchased during the month purchased and shipped using this same $3 mini- need an item for some period in the future, the most optimal case is that the item is not procured or deliv the expense for managing these items, and total costs of April and all of those sutures were used in the same mum shipping (weight of 10 items falls under the month, a $1000 supply expense would be recorded in weight restrictions), then shipping costs per unit red until as close to point of need or consumption only get bigger. Since most hospitals are nonprofit and are not that month. If that same amount of sutures were pur- would be only 15% of the total cost (i.e., $3 + 10 as possible. This is called postponement, which is chased in April but half were not used as of the end items = $0.30 per item; $0.30 + $2 = 15%). one of the trends described in Chapter 11. For exam required to follow generally accepted accounting prin- ple, if a hospital paid for $1 million of pharmaceutical ciples to consistently record expenses and inventoryprecasting practices would probably haugh curren Valuation Methods 247 246 Chapter 17 Financial Management of Inventory in the period in question. An entry should have been whod supply expenses might be comparable. Criteria should be defined so that each depart- of that month, then the remaining unused pornoil made to record this as inventory because it is pre is very difficult to explore utilization of supplies ment and location purchasing and storing materials would check the following: that purchase is shown on the balance sheet as capital- Ar ized inventory. paying a future expense and it is used for items pre- inventory on a per-procedure basis , especially in Chargeable means that if the purpose of the erating revenue . If the hospital had booked the and ihospitals, given the current state of information aterial is to charge it back, directly k, directly or indirectly inventory , no net effect on operating expenses for that larger is used for inventory management in hospitals. Are the items held for sale to patients directly (i.e., through HCPCS codes) or indirectly (i.e., (through room or procedure fees) to patients, and if month would have been noted and the hospital would jog an activity-based costing approach to through bundled hospital room or procedure charges)? have shown a $2 million profit for the period. Cur- line management in clinical settings would be it is not cons med by the end Are the items consumable? entory. If an item has no role in reimbursement rent assets would have increased by $5 million, and or administrative purposes), then more than likely accounts payable (i.e., a short-term sighly advantageous to track actual quantities of items vilized relative to patient reimbursements. Are they greater than the dollar amount defined ose items , whether or not they are used liability ) would have increased by the same amount . in that period , is probably expensed . ( Note: if there is a The net effect on cash flow would remain unchanged till most industries there are three classifications of as "material" or significant to the hospital's finan cial records? (This must be defined based onng significant amount of monies represented, these could during that month. ventory : raw materials, work in process , and finished This is not an accounting scheme or game . Instead , ds. Most hospitals deal with only finished goods size and unique situation of each hospital because as prepaid assets, but they would not be no standard material threshold exists.) be capitalized as prepaid a considered "inventory.") t represents matching expenses to the appropriate Bentory , which refers to items that are complete and period in which the revenue was incurr wady for sale (i.e., there is no conversion or manufac Are the materials owned by the institution and was incurred as is called "ring that must be done to make them usable ) . not leased, rented, or otherwise consigned to the hospital? for under the Matching Principle of Accounting. Impact of Timing on Because the hospital did not use or charge a patient "There are two other types of inventory . Con - for the pharmaceuticals, the expense should not be signment out reflects the hospital's inventory that is Are the materials used in permanent and ongo- ing service lines? (i.e., they are not to be used in a Expenses recorded , and the future benefit of the current asset ed elsewhere for sale. This type of consignment pecial one-time situation.) should be offset by an expense at a future date. might be where a hospital provides certain supplies to Consider this example. A large hospital purchases $5 other facilities or even retail stores for them to resell . The capitalization criteria defined should be con- million of pharmaceuti preparation for a cate- sistent across all areas of the hospital and should iden- gory 4 hurricane that is he y. The Consignment-out inventory needs to be recorded on the hospital's books and routinely counted to be sure tify each unit, floor, and nursing station that holds distributor delivers 1200 tote boxes of medications , Important Facts About that the recorded value is correct , since that inven inventory and then apply the criteria comprehensively. tory is usually not under the hospital's direct control. Any inventories that meet thi which are put in a back room just in case . The date Inventory cally counted , valued , hould be physi- is July 29 . The hospital continues operations ; fortu - nately the storm never reaches the city, and all oper- Inventory on most hospitals' books is severely under- The opposite of this, consignment in, measures corded in the general led- ger on the balance sheet (this assumes, of course, that ations continue as normal. Those medications remain valued. If all hospitals complied with GAAP and somebody else's inventory (i.e., some type of vendor, the items are not already in a perpetual inventory sys - unused but the payment for them is recorded as an Financial Accounting Standards Board pronounce- either the manufacturer or the distributor ) that is tem, which will be discussed later). Even when a per- expense when paid. The general le dger officially then ments, there would be a much broader emphasis on being held or stored on the hospital's facility at no petual inventory system is in use , counts shown in that closes for the month, and the hospital finds itself with comprehensively counting and valuing hospital inven- charge until sold. Examples of this are orthopedic system must be periodically verified with cycle counts. a $3 million loss. That loss would be a direct result of tories. For this reason, however, benchmark compar- mplants (such as an artificial hip), stents and other the recording of the purchase of those medications as isons about inventory levels with most hospitals will expensive cardiology or operating room supplies, a precaution against an emergency need . This is fairly not yield fruitful results due to the undervaluation and where a vendor will place them onsite until they are Valuation Methods for most hospitals. lack of consistency in treating supply expense versus consumed. At the point of usage, the vendor is paid, The quality and maturity of information systems nventory. expenses are increased, and the vendor's inventory is One of the most important decisions to be made in The cost of inventory is directly related to the decreased. The hospital does not own inventory that inventory management is the choice of account- used in most healthcare settings for managing sup- plies, inventory, and the supply chain are generally relative severity of patients served by a hospital, as is consigned in, so it does not include it on its bal- ing valuation methods. Valuation is an assessment poor, in comparison to other industries. In retail, man- described by its case mix index. Case mix index (CMI) of the financial value of an asset (Koller, Goedhart, ance sheet. ufacturing, and consumer goods industries, sophis- is calculated based on classification schemes such as Wessels, & Schwimmer, 2015). This is an important ticated enterprise resource planning (ERP) tools are decision and has broad financial impacts, but in the diagnosis-related groups where each group is assigned used to manage the movement of goods through all healthcare industry it is not well understood even by a relative value of severity, with a higher value repre- Criteria for Inventory parts of the organization with extreme precision. In accountants-especially if they do not come from senting a more severe case. Therefore, a hospital that health care, however, most of the larger hospitals and To capitalize the value of materials on the balance other, more inventory-intensive industries. has more intense, complicated, and resource-intensive systems use some form of ERP, but the configurations procedures (and so a higher case mix index) will likely sheet, there have to be criteria that determine mate- Accounting Research Bulletin 43, Chapter 4, is the official pronouncement with the highest level were not originally set up to bring the hospital systems see a higher percentage of its operating budget being riality (i.e., what dollar threshold should be placed up to the same level of functionality. As hospitals real- authority in GAAP, and it lays out the inventory spent on supplies and inventory. on inventory that is capitalized versus expensed) ize the potential savings of ERP usage, they are mov- The larger the hospital, in terms of beds and pro- and what makes inventory unique to each hospital. pricing conventions (FASB, 2018). There are a mul- ing to increase their technical sophistication in this Without criteria in place, and without complying titude of valuation methods in use, but the three cedures performed, the higher the associated supply area above simple inventory count ledgers and online with GAAP accounting requirements, organizations most common are first in, first out (FIFO); last in, expenses. Inventory, however, reflects efficiency in purchase order applications currently in wide use in would just immediately expense all items that were first out (LIFO); and weighted average. Other less the industry. utilization and in planning and may not be directly common methods are dollar-value LIFO, retail related. A hospital that employs quantitative plan- purchased, which of course does not properly reflect The hospital described in the earlier example did method, specific identification (used for high dol- ning and inventory techniques and attempts to model timing and matching principles in accounting not use or consume the $5 million of drugs purchased lar items, such as airplanes, where specific units are inventory using economic order quantities (EOQs) or (Bragg, 2006).248 Chapter 17 Financial Management of Inventory health care in that it does not reflect the true phys- "how of goods, where most medical supplies and Lower of Cost or Market 249 TABLE 17-1 Example of Purchase and Inventory Data for Hypothetical Hospital have expiration dates that require earlier prod- dry to be sold first . It does have an advantage in that TABLE 17-2 Comparison of Expense Recorded and Ending Inventory Values Units Price/Unit ($) Total ($) whatches the most current cost against current rev - it's, but the balance sheet appears undervalued Method Beginning inventory balance , July 1 20X4 200 1050 live to current market or replacement costs . The Expense Ending Inventory relawsuit is that net income under the LIFO would FIFO Purchases September , 20X4 200 6.09 1218 "lower using this method in this period, as long as $6419 $2329 6.44 $7089 Purchases November 1, 20X4 200 1288 wantities remain constant or increase. " Using the same data for Hypothetical Hospi- $1659 Purchases January 1 , 20X5 300 7.00 2100 in Table 17-1, the ending inventory valued using Weighted average $6729 the LIFO method is calculated using costs from the $2019 Purchases March 1, 20X5 300 7.63 2289 wewinning of the fiscal year to calculate an average cost for the 300 bags still on hand at June 30, 20X5. Since The net impact on the financial statements using HIFO assumes the items in inventory are the oldest , the weighted average method would be lower net Purchases May 1, 20X5 100 8.03 803 1300 8748 the calculation starts with the 200 bags on hand at the income than FIFO but higher than LIFO. Comparing Total beginning of the year and the remaining 100 bags (to the expense amounts and ending inventory balances for Hypothetical Hospi methods described Ending inventory balance, June 30, 20X5 300 get to the total of 300 bags on hand ) . The average cost I under each of the three $5.53 is calculated as [(200 x 5.25) + (100 x 6.09)] : re is shown in TABLE 17-2. Most hospitals choose to use either FIFO or 300 = $5.53 and that amount is multiplied by the 300 weighted average for their valuation methods. Most bags on hand to arrive at the $1659 estimated value of information systems can support either of these, and recorded) and moving average. Choosing a method hand to estimate the ending inventory value at the end inventory on hand at June 30, 20X5: it is acceptable to use a combination of several meth- can have different effects on the financial state - of the fiscal year: ods, as long as it can be su Cost/Unit Total ant thing is to select st import- ments, especially if prices are continually changing. Units these methods and stick These differences will be illustrated using the exam- with it . This consistency principle is important so that ple of Hypothetical Hospital where during its fiscal Units Cost/Unit Total July 1 cost 200 x $5.25 = $1050 comparisons can be m year beginning July 1, 20X4, it recorded the follow- March 1 ing purchases of intravenous ("IV") solution bags as 200 X $7.63 = $1526 100 X $6.09 = September 1, 609 shown in TABLE 17-1. purchases Lower of Cost or Market 20X 4 purchases First in, first out (FIFO) is probably the most May 1 purchases 100 x $8.03 = (applied to 100 Regardless of the method of inventory costing cho- common valuation method in health care. It assumes 803 (applied to 100 units) sen, the value has to follow the "conservative" prin- that the first unit purchased is the first unit sold, and units) ciple of accounting, which states inventory should be therefore the units that are remaining in inventory are 300 $1659 valued at the lower of cost or market (LCM). The the last units purchased. 300 complexity in this is to understand what is meant by Using the example of Hypothetical Hospital from $2329 Cost/unit for inventory valuation $5.53 cost." Determining market cost is a little complex, as Table 17-1, the FIFO valuation of inventory would be Cost/unit for inventory valuation $7.76 described next, but market typically refers to the cur- completed like this. The hospital had 400 bags of IV Total Inventory Value at June 30, 20X5 $1659.00 rent replacement cost or cost to purchase a new unit. solution on hand, so a price must be assigned to those Total Inventory Value at June 30, 20X5 $2329.00 The first step is to determine the market cost. Hos- units of stock on hand to record a value of that inven- Another common valuation method used in itals should use the concept of a "ceiling" and "floor." tory on the balance sheet. Since FIFO assumes the health care is weighted average. Weighted average A ceiling is the upper limit, defined as selling price first items received are the first ones used, the ending In an environment in which prices are rising, assumes that the cost should reflect the averages of all minus all cost to sell the items, which also is called the inventory is valued based on the latest purchases-in FIFO expenses the lower-costing items first, which tems purchased over time. Using the data for Hypo- net realizable value. Next, look at the floor, which this case from purchases in March and May of 20X5. therefore causes net income to be higher than other is defined as the ceiling minus the normal expected The process works in reverse where the May purchases thetical Hospital in Table 17-1, the weighted average methods and leaves higher cost items as on the shelf of 100 bags are assumed to be among the 300 bags still method would result in an ending inventory balance profit margin. The result is two numbers, a ceiling and in inventory at the end of the accounting period (this on hand at the end of the fiscal year. The remaining of $2018.77 using the following: a floor, and the market price will fall somewhere in will be discussed in more detail later). that range. Now, compare the current replacement 200 bags of solution are then assumed to be from the Under last in, first out (LIFO) method, the prem- purchases made on March 1, 20X5. The 200 bags from Weighted average total $8748 costs for that item to the range. In general, hospitals ise is that the last unit purchased is the first unit sold. $ purchases use the replacement cost if the replacement cost fits March purchases and the 100 bags from May pur- Alternatively, the oldest item in the inventory would $6.73 between the ceiling and the floor. If the replacement chases are then combined to create a cost per unit for be the first item purchased. This method assumes that Total items purchased 1300 cost is below the floor, use the floor. The second step the 300 bags on hand at June 30, 20X5. The average sales are made from the most recently acquired units is to compare the historical cost to the market figure cost for the 300 bags using this method is $7.76 per and that ending inventory is comprised of the oldest Total Inventory Value at $2018.77 calculated earlier. Hospitals report the lower (or more bag and that amount is multiplied by the 300 bags on available goods. This method is generally problematic June 30, 20X5 conservative) of the two figures.proved inventory replenishment plans, actual micting Accounting Entries for Supply and Inventory 2 250 Chapter 17 Financial Management of Inventory Pion histories are associa "curred-which is vital to predicti inventory) as well as receipts or additions to atwhich they occurred- with perpetual inventories, the basic calculation of inventory is : herating usage forecasts for the future, Consider this example. A drug is purchased for reflects the original purchase cost. The inventory.ly smaller, more controlled emanother advantage to perpetual systems is that ow help materials managers avoid excessive inventory BI+P-COGS=ET item, and there - 3 . They are usually sme where , markup is 30% on fore the sales price is $260. Additional selling costs are environments where all ins and outs can be his throughout the year. Working capital, the net cur- estimated at 10% of cost on all pharmaceuticals, and monitored . so the net realizable value is : Perpetual systems can best be used in situations "not resources necessary to sustain operations, should "held as minimally as possible so that investments in BI = beginning inventory, in units and dollar value P = cost of the units purchased ($200X1.3)-($200X0.10) =$240 involving a small number of locations with a high dollar unit value, whereas periodic systems are often bere productive assets can be made. Inventory is one more key components driving increases in working COGS = the cost of goods sold for issues to Thus, $240 is the ceiling price. The floor is defined departments and patients rmal profit margin, which is $60 as the ceiling less normal profit In decentralized storage areas of the hospital ( some of the so a more detailed, real-time understanding of times referred to as a par or supply room), there is Opentory will lower working capital requirements. EI = ending inventory ($260 - $60) = $200. The current "sample, or ($260 - $6 in this example, o typically no centralized co "perpetual inventory systems also allow for the use replacement cost for that same item is $225 . Because oring of sup- iple people over several fautomated replenishment versus manual ordering For example, assume that there is $500,000 in this replacement cost falls inside the relevant range, beginning inventory on January 1. Inv the replacement cost of $225 will be used for inven- shifts come in and out of these areas to retrieve items of " replenishment processes. Obviously, automated for patients, and in these cases a perpetual sys "denishment is less people-intense, more efficient , debit balance on the balance sheet and reads $500,000 tory valuation purposes. most hospitals have thousands of In practice, most hospitals not necessarily appropriate or cost effective ( the use of and less expensive in the long run, but it is also faster under current assets. (Note: Recording of debits in the following examples will be referred to using the items to manage, so it is impossible to calculate an supply automation that enables perpetual monitoring and ensures fewer stockouts (i.e., having zero items on even in decentralized locations is discussed later) . abbreviation "DR," while credits will be "CR.") During LCM on each item. The principle is important but, in practice, very difficult ry difficult to manage without good sys- In a periodic inventory, a physi a shelf when an item is needed). Two ways these per- physical count is taken Notual systems can automate the replenishment pro- January there were total purchases of $1,000,000. The tems. The real di al distinction that most hospitals make is once at the end e fiscal period. Receipts entry to record, assuming that the invoice was not storical cost or replacement cost or purchase rs are typically incremented cess are: paid immediately from a cash account, would be: (which is captured in the earlier discussion of LIFO, to separate purchases or expense accounts . A physi - Forecasting an order based on transactional FIFO, and weighted average ) . cal count of inventory at the end of the next period usage history, which will generate an automatic DR inventory $1,000,000 yields a figure, and the difference between the begin - order based on previous consumption patterns. ning and the ending inventory is adjusted to find the Using predetermined minimum and maximum ( min-max) levels. This is discussed in more detail CR accounts payable $1,000,000 Periodic Versus Perpetual true cost of goods sold (COGS). COGS becomes the supply expense for the period, which reflects actual later, but basically if current inventory falls below Systems usage of items, or the delta between beginning and the minimum required on hand, an automated In other words, a liability is created, and there is order is placed for the difference between the an offsetting asset for the same amount. Assume that Another choice to be made with regard to inventory ending period positions. Alternatively, items could minimum and the current quantity. there were sales or issues of $1,750,000 for charges is whether to manage items on a periodic or a per - e expensed as procured, and then an adjustment petual basis. Periodic inventory in general is easier to is made for any differences at the end of the period. When using periodic inventory, the ending inventory At most hospitals there will be a combination of to be reimbursed by payers for supplies that were both perpetual and periodic systems. The perpetual given to the nursing units or floors for direct dispens- record of items that are sold or purchased, so a real- in units is multiplied by the FIFO or weighted average values to determine an inventory balance . system is preferred, as long as the cost of using such a ing to patients. The entry to record this transaction time balance of inventory on hand is never available. system does not exceed the benefits derived (avoided would be : Periodic inventory relies heavily on physical counting A perpetual inventory system, however, recalcu costs of stockouts or holding of excessive inventories ) and observation of goods because no system is used to lates based on each transaction occurrence. If begin- However a perpetual system may not be practical in DR accounts receivable $1,750,000 ning inventory is 5, and 3 items are purchased the next rack balances. month, the total goods available for sale is 8. Subtract all locations, especially in small organizations with a Perpetual inventory, on the other hand, keeps the issues to patients or floors to get the ending inven- fairly narrow range of products used in few storage CR revenue $1,750,000 a running record of the inventory balance on hand at tory balance. Automated ERPs and materials manage- ocations. For that reason, an understanding of the all times. Perpetual inventory is very common in retail ment information systems allow for real-time entry accounting treatment for both periodic and perpetual and manufacturing industries, where having a precise When the actual payment is made to the manufac idea of inventory on hand is very important. In health of receipts as supplies come through the receiving inventory is important. Under either scenario, peri- turer or distributor, based on the contractual invoice dock and issues as they are charged out to patients or odic physical inventory counts (cycle counts) have to care, it is used less, although the trend is to incorpo terms, an entry would be made to reduce cash and to rate more perpetual systems throughout hospitals as patient care units. be conducted to verify the accuracy of records in the reduce the liability, as follows: reimbursements cause hospitals to be more judicious The real advantage to a perpetual system is that it perpetual inventory or accounting records. in the amount of money they can invest in inventories. provides valuable information about supply expenses OR accounts payable $1,000,000 In central stores and the warehouse, perpetual and inventory values throughout the year. If a hospital systems are commonly used. They can be used here is only interested in its end-of-year financial position, CR cash $1,000,000 then either method will yield the same result, Since most Accounting Entries for Supply for several reasons: hospitals today are encouraging sound financial prac- 1. A person usually works the location and is ices and continuous performance measurements, intra- and Inventory Next, an entry will have to be made to record responsible for closely guarding the inventory. period inventory balances are extremely important for Accounting treatment is different depending on 2. A system at this point can be used to enter the cost or expense of the items that were sold. Using monitoring operational and financial performance, In whether the hospital or department is working in the requisitions from units (or issues against FIFO and ensuring the LCM, the hospital determined addition, this same perpetual information will drive perpetual or the periodic environment. Starting first. general ledger balance to the new correct level. is adjustment would be recorded as: Inventory Ratios 253 252 Chapter 17 Financial Management of Inventory inventory: eventually, all errors self-correct over time . So , if inve that $900,000 in inventory expenses was consumed. Notice that these purchases are not recorded into $22,000 not counted 1 year, The entry would be: petual method. Also, the RCOGS/supply expense entry to record the revenue and accounts receivable $22,000 dervalued inventory and higher would remain the same: supply expense on the income statement, it will DR supply expense (COGS) $900,00 Rinventory caught and fixed in the second year CR inventory DR accounts receivable int discovers the error and makes $900,000 $1,750,000 This adjustment would be called shrinkage or loss, an adjustment. So, by the third period, CR revenue $1,750,000 ich can arise as a result of any number of reasons: tory errors have self-corrected . This may happen with other line items on the balance sheet such The net impact of this is shown in TABLE 17-3. as in the valuation of discou net impact is a $100,000 increase in inven- Failure to charge out properly to patients as items Thus, the net impact is as were dispensed or utilized . in of discounts on receivables for tories on the balance sheet. The impact on the The entry to record the payment to the vendor is much the same reason-an error in estimate in statement , for these transactions only , shows a positive the same as the previous entry for perpetual: Misplacement or overuse of drugs or supplies. one period can be offset by an error of the same magnitude in the opposite direction. Cating margin of $850,000 (or $1,750,000 in sales Items that have passed the expiration date or are less $900,0 DR accounts payable $1,000,000 obsolete and therefore have no value . Under periodic inventory accounting, the treat- Loss due to theft. Inventory Ratios is somewhat different . Beginning inventory CR cash $1,000,000 Pricing or value decreases. stays the same, at $500,000, but instead of booking the Any other general loss. It is important to track inventory ratios and statistics items purchased into inventory, they are recorded to over time , to gauge the health of the business , to mon - temporary purchases or expense account itor utilization, to look for trends , and to ensure inter - a separate, closed at the end of each period. Inven- Since beginning inventory ($500,000) plus pur- chases ($1,000,000) equals cost of goods available Inventory Errors nal controls. The key is to look for consistency of the tory maintains the same balance until the end of the for sale of $1,500,000 and the ending inventory was period , when it would be physically counted again . If Hospital supplies are dispersed geographically and ratios , and if a ratio is far outside of the normal range observed and counted to be $400,000 , the COGS decentralized throughout the hospital in multiple or published benchmarks, then additional research the count reveals only $400,000 worth of inventory would be $1 , 100,000 as shown earlier . The entry then and analysis can be conducted. on hand , the calculation would be made as follows , has to be made to net out the temporary purchases rooms , closets , and other storage areas . A physical One of the key ratios that is used in hospitals is assuming the same level of sales: account and book this to COGS. count of the inventory results in a figure being recorded days of inventory on hand (DIO), which alternatively on the balance sheet as inventory. It is quite common can be called days of supply. This metric measures the Beginning inventory $500,000 +Purchases $1,000,000 DR COGS/supply expense $1 , 100,000 to have errors in the counts, to have pricing discrep amount of inventory on hand relative to an average daily usage. The calculation can be made for either -COGS XX ancies due to a large item master and complex pric- CR purchases $1,000,000 ing structure, or to overlook certain pockets of supply, quantities or dollar values, assuming pricing is rela- = Ending inventory $400,000 which might understate or overstate the balance sheet . tively stable. The calculation for days of supply is: CR inventory $100,000 One concern already stated is the effect that Solving for the COGS shows that it would have to aventory errors have on reported earnings, espe- DIO=Total number of units on hand + be $1,100,000. The transactions would be as follows: cially as inventory does play a role in determining Average daily units used This brings the inventory account down to $400,000 as counted, closes out the purchasing current-period operating margins. For tax-exempt or For example, if there were 1000 syringes on hand, DR purchases $1,000,000 account, and moves all COGS to a supply expense. nonprofit organizations, the relative size of earnings and on an average day 100 were utilized, there would CR accounts payable The net impact on the financial statements using may not matter, but in for-profit hospitals, there has be 10 days of supply on hand. This is simple enough $1,000,000 periodic accounting methods is net operating margin to be careful consideration of the inventory effects on when looking at each item, but when there are thou- of $650,000, versus $850,000 in the earlier example. earnings. Here are a couple of facts to keep in mind ands of items and a materials manager wants to This is just coincidental, however, because both meth- about inventory: measure the portfolio as a whole, it requires conver- ods will yield the same results over time, assuming Overstating EI leads to understating COGS and sion to currency. In that case, the calculation would TABLE 17-3 Inventory Accounting that perpetual is capturing all transactions and that therefore overstating gross operating margin. be total dollar value of inventory on hand divided periodic counts are conducted. Understating EI overstates COGS and therefore by average daily COGS. From the earlier example, assume an average usage or COGS of $1,000,000 aventory In addition, under both the periodic and perpetual understates gross margins. methods, there will have to be entries made to reflect The EI of one period becomes the beginning monthly in a 30-day month and an average inven- ory of $450,000 [($500,000 + $400,000) : 2]. It is Beginning inventory $500,000 any adjustments to inventory. Adjustments are made inventory of the next period. possible to calculate this ratio using just EI values when a comparison of the general ledger to actual An error in one period carries over to the next Issues/ COGS ($900,000) observed quantities shows material variances. For as well, but average inventory is more common. In period, having the opposite effect on gross example, if a cycle count was performed in a perpetual this case: margin. Purchases $1,000,000 environment, and the count showed $100,000 worth Inventory errors generally "correct" themselves DIO=$450,000+$33,334=13.5 days of items but the general ledger reported $122,000, at the end of the second period and are com- Ending inventory $600,000 an adjusting journal entry would have to be made to monly referred to as a "counterbalancing Another useful metric for inventory manage- record an additional $22,000 of expense and reduce error." This is one of the positive facts about ment is inventory turnover. This metric is often usedOther Inventory Calculations 2 254 Chapter 17 Financial Management of Inventory tomer demands it . It can be measured in multiple Isincluding product fill rates or stockout percent- pay's, it here is the most common method. overall inventory carrying costs and reduce working to measure liquidity, because it shows how efficiently caver converting supplies into in terms of percentage of total inventories . For exam - capital, while maintaining adequate service levels. The formula is as follows: the organization is turning ocimilar to the earlier defi- ple, shrinkage percentage would be calculated as: Customer service level = {Q-[E(z)]/ 100} cash. The metric basically ism supply, but it provides another way of nition of days of supply, butof inv. Shrinkage = [(Total book value-Observed value)+ looking at it . The calculation of inventory turnover is : Inventory] 2 (Annual usage in units) * where 0 = order quantity (Cost for one order) Inventory turnover = [Cost of goods sold + Average inventory] Other Inventory Calculations E(2) = expected number of units short EOQ=\\(Annual carrying cost for one unit) - number of standard deviations of safety stock. where the annual supply usage is in units , the order In the earlier example, COGS was $1,000,000 and cost (i.e., purchase or setup costs) is the total costs 20 000. so the inven- There are a number of other important inventory cal - average inventory value was $450,000, so culations that can be used to monitor asset utilization E(z ) can either be calculated with an equation that ch time an item is ordered, and the annual carry- and improve operational efficiencies. These analytical famines annual demand, orders placed, and orders ing cost is the total cost of keeping inventory on hand Another useful metric is gross margin percentage. ulations include safety stock, customer service jo hort, or it can be estimated. For example, suppose This ratio allows tracking of the relative importance els, EOQ, and cycle inventory. Smoothly demand is 100 units and standard deviation ( e.g., warehouse or storage costs, taxes, i of supply cost on a hospital's supply revenue; alterna- "10 units. If there is half a standard deviation, or Carrying cost is usually stated as a percentage of the tively, it can estimate the gross markup on supplies. Safety Stock "0.5, then using a z-value table finds that z = 0.198. al dollar amount spent on products. For example, Bayou Medical Center wants to calculate the EOQ for This figure differs from the actual markup used in Therefore, to solve for customer service level: surgical packs given these facts: the Charge Description Master, of course, which is The basic purpose of safety stock is to carry addi- es and purchase cost, not actual based on gross revenues and pure tional inve y to satisfy unexpected demand (i.e., 100- [(0.198)(10)]+100}=98% Annual usage usage or COGS. The definition for gross margin demand that exceeds 844 or forecasted ) . This unex int expected to be used, percentage is: Alternatively, and to maintain simplicity , fill rates Cost per order can be predicted using the calcu cted demand or variability Gross margin percentage=[(Net supply dard errors are used to measure customer service level. Fill rate is from the forecast and incorporating them into a final the percentage of orders that are filled completely and accurately. Mathematically, fill rates are calculated as: Annual carrying cost/pack 1.25 revenue-COGS ) + version of a forecast. For instance, if the demand plan Net supply revenue] showed 12 units being sold in a specific department Fill rate = R/O Average lead time for delivery 1 Week Assume a hospital generated $500,000 net in in a certain period, and the actual demand was 15 , a venue (i.e., gross revenues less contractual supply revenue (1.e. B shortage or stockout would have occurred . To counter adjustment and discounts for the supplies, assuming the effects of demand variability in the planning pro- where The EOQ in this situation is calculated by: cess , safety stock calculations are used to counter the R = number of purchase orders or lines actually that the entire net amount is collectible), and cost of goods was $210,000. The gross margin percentage uncertainty in the supply chain. Although there are replenished 2 (844 ) x (26 ) would be calculated as 58%: multiple ways to calculate safety stock , here is the most 10) =187 packs 0 = the total number of orders requested or V (1.25) common way, using service levels as the parameter (it is also possible to use fill rates and replenishment pol- submitted [($500,000-$210,000)=$500,000]= In reality, the EOQ is extremely valuable, but it $290, 000+ $500, 000=58% cies to calculate safety inventory): s rarely used in practice because of the difficulties in implementing it and capturing the required data ele- If materials management departments fully Safety stock = sz(p) Economic Order Quantity ments . It works best when demand is fairly stable or charge for all hospital supplies, another useful metric where The economic order quantity (EOQ) is one of the certain and when quantity discounts are minimized . is return on inventory. This metric basically examines host basic calculations used to help firms improve the That is not to say that EOQ calculations cannot be the net income effect of inventory and is calculated as: s = standard deviation of a sample of errors from balancing between demand and supply. This calcu- adapted to take into account the costs and conse- he sales and forecast history lation represents the "best" solution to the offsetting quences of variability in demand, if the costs of car- Return on inventory = Net income + Inventory p = desired customer service levels priorities of minimizing the amount of inventory on rying too much inventory (known as an "overstock" ) If net income ( or operating margin, after subtract- z(p) = z-value or number of standard deviations and, the costs of ordering goods, and the carrying and of a stockout can be estimated, and there is some ing labor, supplies, and other costs from net revenues) from the mean on a normal distribution curve for costs of inventory. EOQ affects order lot sizes, which understanding of the frequency distribution of actual represent the average size in units that a firm should demand. Using the previous EOQ calculation for is $50,000 and the total inventory balance at the end a specific service level. The higher the z-value, the of the period is $500,000, then the return on inventory lower the risk of stocking out. rocure at a given time to take advantage of econo- Bayou Medical Center, assume that management has nies of scale. Since many hospitals use a JIT basis of determined the following additional facts: would be 10%. Analyzing this figure over time helps managers find useful patterns and remain focused on Thus, safety stock builds in previous forecast replenishment and have no inventory outside of the supply profitability. errors and the desired service levels to create inven- distributor, this formula may not be useful for them. Cost of a stockout per occurrence: $9.25 Finally, a shrinkage calculation can be performed. tory buffers. For hospitals that own their own inventory or buy in bulk, and break down and distribute that inventory to Cost of an overstock: $1.25 Shrinkage can exist for a multitude of reasons, include ing theft, lack of internal controls, date expiration of Customer Service Level the nursing units and floors when required, this for- supplies or drugs, and many other factors as explained The customer service level is a measure of the proba- mula will be useful. Using the EOQ formula, hospitals Calculated EOQ 187 packs earlier. Shrinkage or loss calculations can be defined bility that product will be available when the internal can define the optimal amount of inventory to reduce256 Chapter 17 Financial Management of Inventory apractical in the nonprofit hospital structure at this Inventory Policies and Procedures me, given the variety of different treatments that 257 Probability of demand of packs per week : 192 packs-25% if stories and supplies are given. If one hospital documentation is acceptable, and how to report inverses all of its items as purchased and does not timelines back to the general ledger. 177 packs-10% 197 packs-10% of any inventory except possibly what is stored in Instructions for other periodic physical inventory 182 packs-25% The EOQ calculation can be modified to take tral warehouse , then the inventory would be sig - counts . This policy is the same as e as that defined 187 packs-30% into account the costs of overstocks and stockouts, earlier, only for other more compre more comprehensive peri weighted for the probability of demand in this manner: "ntly undervalued and the COGS would appear Muirstated. A ratio for this type of hospital cannot counts, such as the end of the fiscal year. compared equitably against a hospital that com. Treatment of obsolete inventory. This policy should clearly define how to account for obso- Potential Demand (Packs ) hensively values inventory for all locations. The 177 182 187 192 is to select the benchmark hospitals carefully- lete inventories. Obsolete means that the use 197 robably from the for-profit hospital sector that is ul life of the product has expired. This pol more methodical about the use of GAAP and proper should establish which accounting treatments 30% 25% will be given, how to physically dispose of Probability 10% 2596 10% aluation techniques. inventory, and instructions for reverse flow ogistics. Reorder Point Cost ( $ ) Calculation of period end inventories. This policy describes how the final accounting entry will be 177 $0.00 $11.56 $27.75 $34.69 $18.50 $92.50 Inventory Policies and determined for a fiscal period, given the observed 182 1.38 0.00 13.88 23.13 inventory count plus adding all receipts and net- 13.88 52.25 Procedures ting all issues out. 187 EOQ 2.75 3.44 0.00 11.56 9.25 A hospital needs to have a policy in place to ensure Management of consignment inventories . This 27.00 that it is comprehensively and completely valuing and policy should describe physical location of con- 192 4.13 6.88 4.13 0.00 4.63 19.75 managing its inventories. At a minimum, all of the signment inventories, procedures for notes or components described earlier need to be in this policy entries into non-general ledger systems, and 197 . 5.50 10.31 8.25 0.00 27.50 (e.g., valuation method), but the policy should contain general segregation of owned versus consigned all of the following as well: inventories. Inventory capitalization criteria. This policy Use of systems, RFID, and bar codes. This policy In this situation , the user should look for the reor - unless they are tracked and measured over time . An inventory ratio equal to 2.2, without understanding should focus on which inventories to capitalize should lay foundations for deployment of sys- der point that has the lowest total cost, which occurs tems that meet key criteria of automation; use at 192 packs since the $19.75 cost of overstock/stock- the context and specific department, is meaningless ( to hold as an asset on the balance sheet), thresh- standard coding technologies; and allow for real- outs is minimized at that level. In this situation, man- by itself. This ratio must have points of comparison, olds for "materiality," and general expense versus ime, perpetual management of inventories. agement at Bayou Medical Center may elect to adjust such as looking at other departments of similar scope capitalization procedures. Receiving of materials into inventory. This policy its calculated EOQ up to 192 packs to account for the and structure. Most importantly, it has to be tracked Scope and purpose of inventory. This policy governs how materials are systematically received uncertainty in demand . This sort of adjustment may consistently over time to see if the metric is improv- should detail the extent of coverage and the role nto a hospital resource system and describes the introduce a degree of "reality" to address the limita- ing, stable, or declining. of internal auditing in inventory management accounting entries necessary to increment inven- tions of the traditional EOQ calculation noted earlier. Second, there have to be average values and stan- and should generally provide the framework for tory, plus how to track and manage inventory dard deviations that are expected for each metric. concepts of inventory accounting. once it has been received. Treating shrinkage and suspected inventory losses. Cycle Inventory Tracking the ratio monthly relative to the average Periodic versus perpetual. This section, if not This policy discusses the accounting entries nec The calculation of cycle inventory is used to manage and minimum-maximum standard deviations pro- detailed in other policies, should focus on the method of accounting for inventories-either essary to support shrinkage and loss, and also vides very useful information that allows application the effects of lot sizes that cannot be matched precisely perpetual or periodic-and discuss which is describes the documentation required in the to actual demand (e.g., if a hospital needs to produce of exception management and looks for red alerts and appropriate, preferred, and allowable. event of theft. Loss prevention procedures should 100 units to balance demand with supply but the potential problems. Third, ratios have to be tracked relative to other Definition of supply versus inventory. This policy lso be documented here. equired lot size is 200, the difference-averaged over Inventory measurements and metrics. This policy hospitals in the industry. A 2.2 turnover ratio in the s probably a subset of a policy listed earlier, but time-is the cycle inventory). The calculation is fairly healthcare industry means nothing by itself. Attempt- should clearly define when to expense supplies sets the required inventory calculations that must straightforward as follows: be managed by each inventory location, include ing to benchmark turns in health care against other versus capitalize them. ng a description of the metric, a definition, and Cycle inventory =(Lot size+2) industries is irrelevant. Average turns in the publish- Inventory reporting requirements. This policy acceptable data sources. ing business might be 50, while the grocery indus- should describe the timing and nature of man- Approved inventory valuation methods. This pol- try might be 20, because the industry has expected agement reporting, as well as define acceptable icy outlines which of the GAAP are allowable Limitations of Inventory demand variability that drives unique inventory metrics and baselines. or each hospital, whether they are LIFO, FIFO, behaviors. Instructions for cycle counts. This policy should weighted average, retail method, or some other Ratios Fourth and most important, if inventory is not provide details around cycle counts, if used in method. consistently and comprehensively measured in each a perpetual or periodic method, and describe Inventory records retention. This policy gov- There are four limitations to the use of inventory location, it is impossible to produce valuable statis- how they should be administered, what pre- erns the retention period (i.e., length of time a ratios in health care. First, all ratios are meaningless tics. Comparison of inventory benchmarks is fairly count instructions are required, what level ofInventory Planning 259 258 Chapter 17 Financial Management of Inventory Annual Usage Cost/ Unit (5) em SKUA Volume in (5) Cumulative % document must be maintained by regulatory it could possibly reduce total inventories by nearly 200,000 Volume in Cumulative % 2.13 SKU# bodies) for inventory records, including systems -with no service impact on operations. How- 426,000 transaction history. attempting to mar 6449 24,000 9.07 35.6 10% Internal pricing and charging . This policy outlines hospital storeroom can prove dau e items in a 217, 680 how internal pricing, cost transfers, or other cigarities on the highest impact daunting and setting highest impact items may help , 53.7 8,000 14.24 20% chargeback processes work for supply cost alloca- address customer satisfaction and minimize the costs 13,920 tion to floors and units, if any. of managing inventories. 12750 63.3 600 144.56 30% Applying the ABC model to priority setting in 86.736 inventories will assist managers in focusing on the 87159 705 140 40% Inventory Planning parts of the inventory that can have the 600.00 impact to the organization can have the most favorable 84,000 organization. Usually, an ABC system 09243 775 50% Planning and managing inventory are vital to effect groups inventory into three classin 6,000 assifications-"A" for the 12.76 76,560 tive inventory management, sales and 20% of items the highest proportion of the 83.9 60% aning and or both of which will be described organization's inventory, " B" for the next 30% of items, 10,000 6.00 50,000 and "C" for the remaining ing 50% of items. This type of 70140 88.9 70% ). The purpose of inventory is to buffer the vari- classification can be illustrated using the example o 3,250 16.01 52,033 17824 93.3 ability inherent in both supply and demand environ- Hometown Hospital, where the 10 items in the hospi- 80% ments. In a perfect world, where demand is constant tal inventory identified by stock-keeping unit (SKU ) 225 201.98 45,446 21599 97 . 1 and manufacturers or distributors supply the exact number are listed in TABLE 17-4. 90% amounts in the plan , no inventory is necessary . How - The inventory list should be sorted from high to 2,350 14.98 35 , 203 82183 100.0 100% ever, in real life, this variability or fluctuation in low in terms of dollar volume ( the rightmost column the market is inevitable, and effective business pro- in Table 17-4) to assign the highest dollar values at the $1, 197 577 cesses have to be put in place to plan and manage top of the list. Total accordingly. The key aspects of inventory planning include: The ABC classification is based on the column at category "B," and the remaining 50% in category "C" as depicted here: 1. Establishing safety and cycle inventory policy he far right of the previous table, where the top 20% levels. TABLE 17-4 Listing of Items in the Inventory at fSKU are placed in category "A," the next 30% on 2 . Obtaining the right amount of items just at the Hometown Hospital umulative % SKU Volume point o
Step by Step Solution
There are 3 Steps involved in it
1 Expert Approved Answer
Step: 1 Unlock
Question Has Been Solved by an Expert!
Get step-by-step solutions from verified subject matter experts
Step: 2 Unlock
Step: 3 Unlock
Students Have Also Explored These Related Accounting Questions!