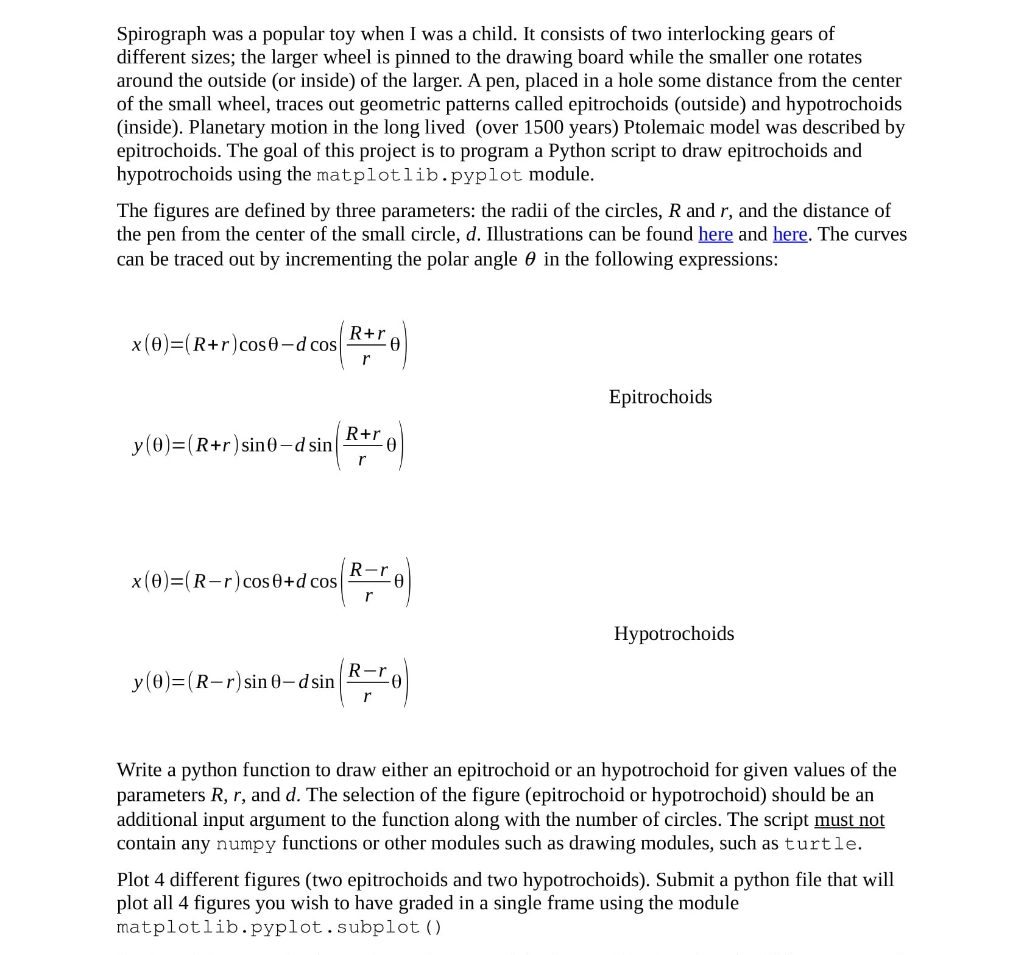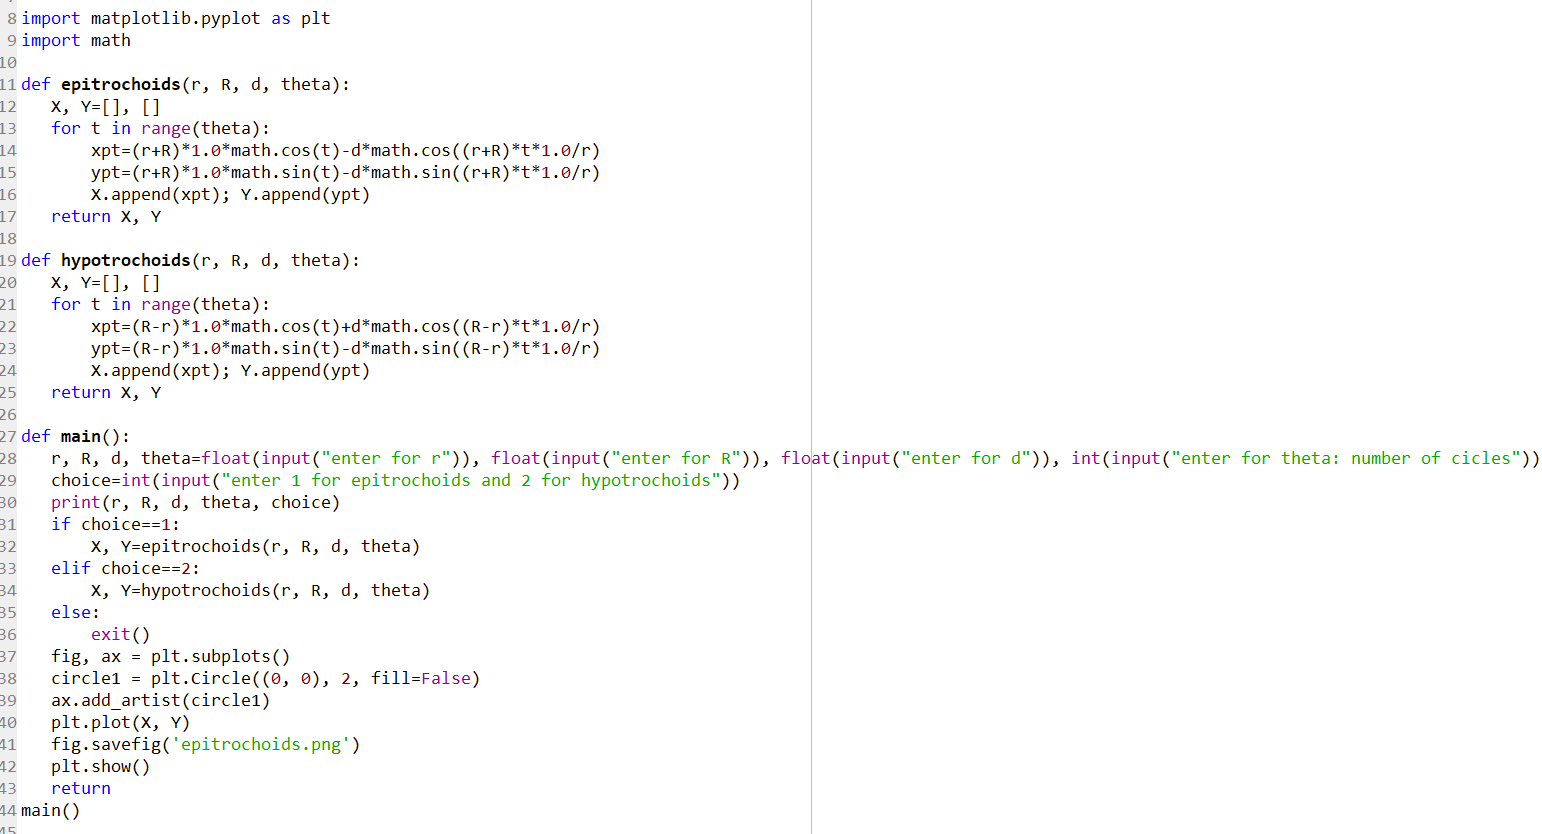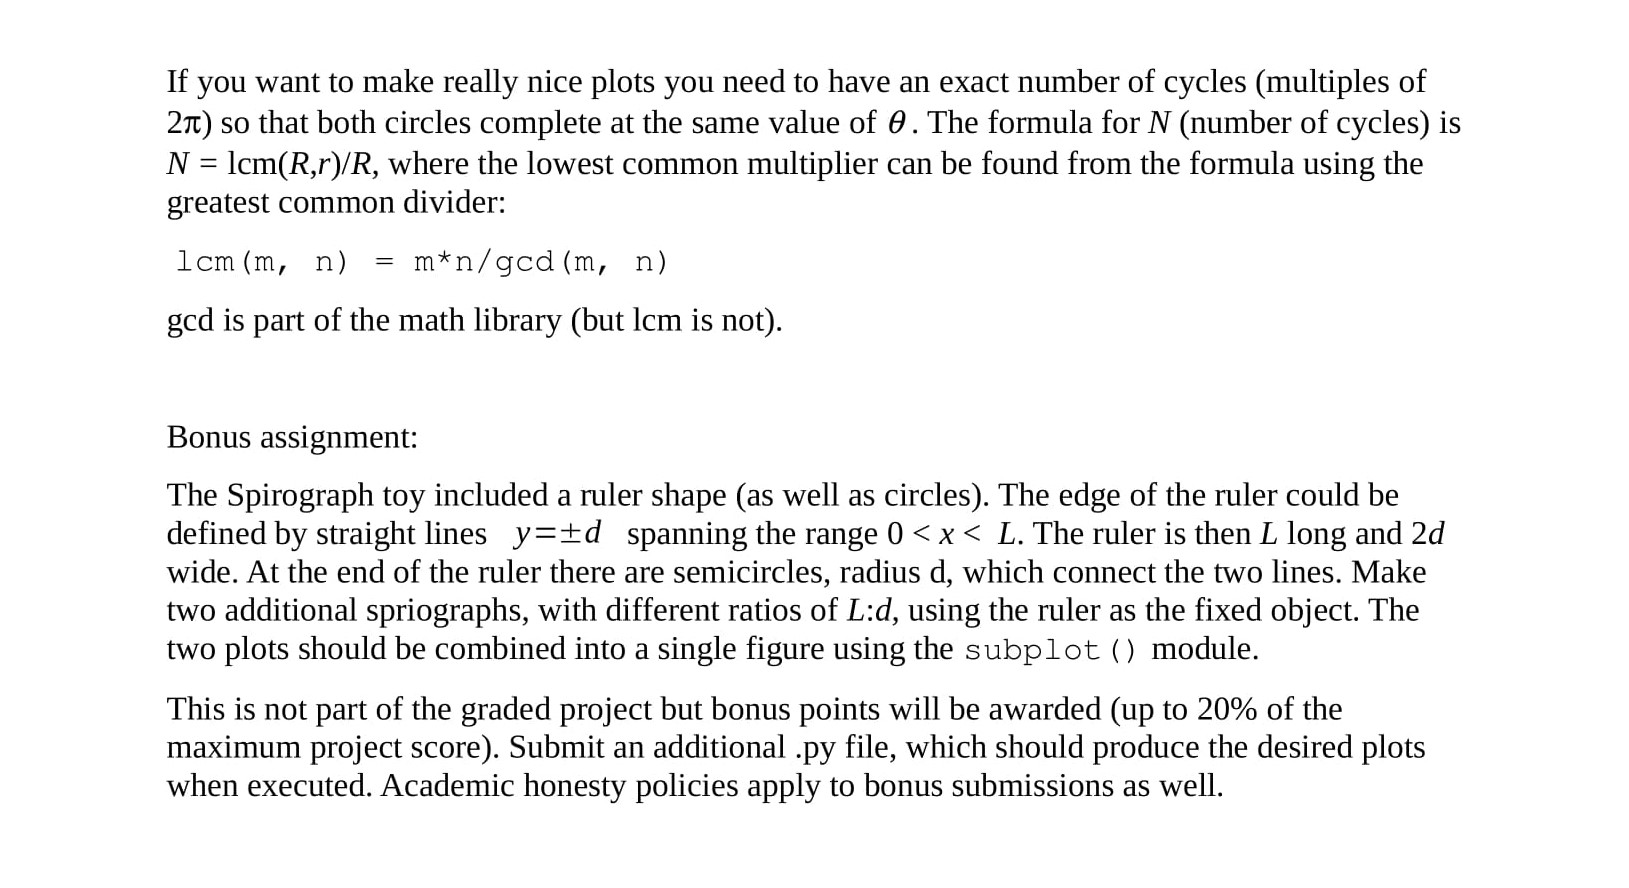


Spirograph was a popular toy when I was a child. It consists of two interlocking gears of different sizes; the larger wheel is pinned to the drawing board while the smaller one rotates around the outside (or inside) of the larger. A pen, placed in a hole some distance from the center of the small wheel, traces out geometric patterns called epitrochoids (outside) and hypotrochoids (inside). Planetary motion in the long lived (over 1500 years) Ptolemaic model was described by epitrochoids. The goal of this project is to program a Python script to draw epitrochoids and hypotrochoids using the matplotlib.pyplot module. The figures are defined by three parameters: the radii of the circles, R and r, and the distance of the pen from the center of the small circle, d. Illustrations can be found here and here. The curves can be traced out by incrementing the polar angle in the following expressions: x(O)=(R+r)cose-d cos Epitrochoids y(0)=(R+r) sino-d sin x(O)=(R-r)cos +d cos Hypotrochoids y(0)=(R-r)sin 0-dsin Write a python function to draw either an epitrochoid or an hypotrochoid for given values of the parameters R, r, and d. The selection of the figure (epitrochoid or hypotrochoid) should be an additional input argument to the function along with the number of circles. The script must not contain any numpy functions or other modules such as drawing modules, such as turtle. Plot 4 different figures (two epitrochoids and two hypotrochoids). Submit a python file that will plot all 4 figures you wish to have graded in a single frame using the module matplotlib.pyplot. subplot () 8 import matplotlib.pyplot as plt 9 import math 10 14 11 def epitrochoids (r, R, d, theta): 12 X, Y=[], [] 13 for t in range (theta): xpt=(r+R)*1.0*math.cos(t)-d*math.cos((r+R)*t*1.0/r) ypt=(r+R)*1.0*math.sin(t)-d*math.sin((r+R)*t*1.0/r) X.append(xpt); Y.append(ypt) 17 return X, Y 16 19 def hypotrochoids(r, R, d, theta): 20 X, Y=[], [] 21 for t in range (theta): xpt=(R-r)*1.0*math.cos(t)+d*math.cos((R-r)*t*1.0/r) ypt=(R-r)*1.0*math.sin(t)-d*math.sin((R-r)*t*1.0/r) X.append(xpt); Y.append(ypt) 25 return X, Y 26 mm 27 def main(): 28 r, R, d, theta=float(input("enter for r")), float(input("enter for R")), float(input("enter for d")), int(input("enter for theta: number of cicles")) 29 choice=int(input("enter i for epitrochoids and 2 for hypotrochoids")) 30 print(r, R, d, theta, choice) if choice==1: X, Y=epitrochoids(r, R, d, theta) elif choice==2: X, Y=hypotrochoids(r, R, d, theta) else: exit() fig, ax = plt.subplots() circle1 = plt.Circle(0, 0), 2, fill=False) ax.add_artist(circle1) plt.plot(X, Y) 41 fig.savefig('epitrochoids.png') 12 plt.show() 13 return 14 main() 15. If you want to make really nice plots you need to have an exact number of cycles (multiples of 21) so that both circles complete at the same value of 0. The formula for N (number of cycles) is N = lcm(R,r)/R, where the lowest common multiplier can be found from the formula using the greatest common divider: lcm (m, n) = m*n/ged (m, n) gcd is part of the math library (but lcm is not). Bonus assignment: The Spirograph toy included a ruler shape (as well as circles). The edge of the ruler could be defined by straight lines y=+d spanning the range 0


