Answered step by step
Verified Expert Solution
Link Copied!

Question

1 Approved Answer

Spreadsheet eBook An appraiser collected the data found in the file Appraiser.xlsx describing the auction selling price, diameter (in inches), and item type of several
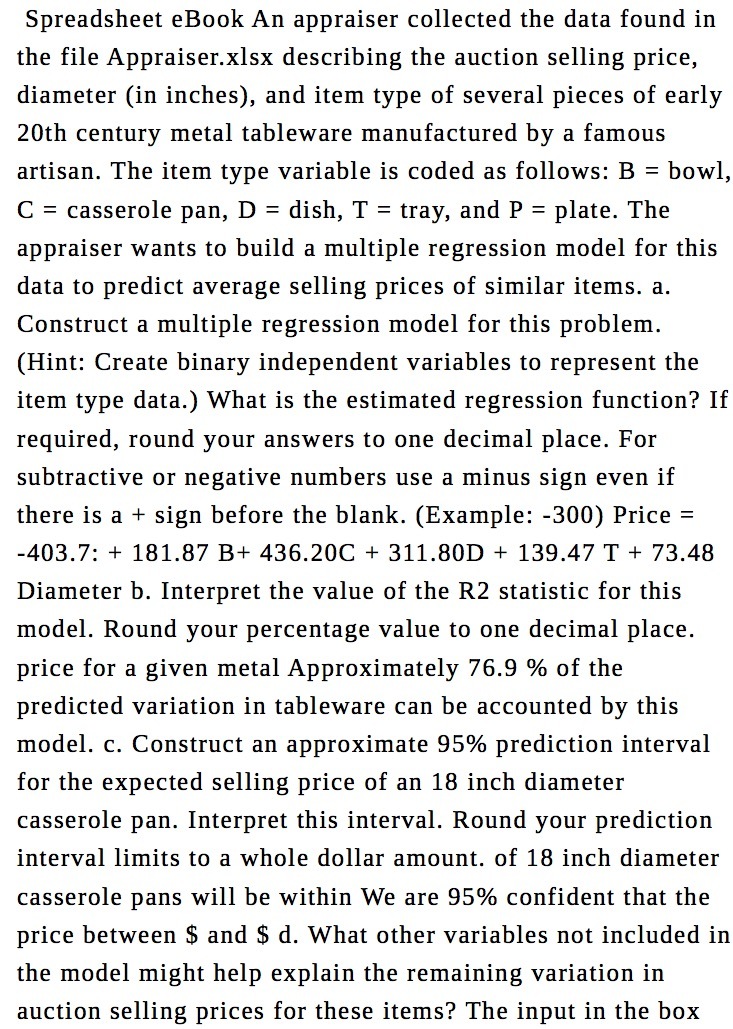
image text in transcribed
Spreadsheet eBook An appraiser collected the data found in the file Appraiser.xlsx describing the auction selling price, diameter (in inches), and item type of several pieces of early 20th century metal tableware manufactured by a famous artisan. The item type variable is coded as follows: E = bowl, C = casserole pan, D = dish, T = tray, and P = plate. The appraiser wants to build a multiple regression model for this data to predict average selling prices of similar items. a. Construct a multiple regression model for this problem. (Hint: Create binary independent variables to represent the item type data.) What is the estimated regression function? If required, round your answers to one decimal place. For subtractive or negative numbers use a minus sign even if there is a + sign before the blank. (Example: -300) Price = 403.7: + 131.87 B+ 436.20C + 311.3013 + 139.47 T + 73.43 Diameter b. Interpret the value of the R2 statistic for this model. Round your percentage value to one decimal place. price for a given metal Approximately 76.9 % of the predicted variation in tableware can be accounted by this model. c. Construct an approximate 95% prediction interval for the expected selling price of an 18 inch diameter casserole pan. Interpret this interval. Round your prediction interval limits to a whole dollar amount. of 13 inch diameter casserole pans will be within We are 95% confident that the price between 35 and 55 d. What other variables not included in the model might help explain the remaining variation in auction selling prices for these items? The input in the box

Step by Step Solution

There are 3 Steps involved in it

Step: 1

blur-text-image

Get Instant Access to Expert-Tailored Solutions

See step-by-step solutions with expert insights and AI powered tools for academic success

Step: 2

blur-text-image

Step: 3

blur-text-image

Ace Your Homework with AI

Get the answers you need in no time with our AI-driven, step-by-step assistance

Get Started

Recommended Textbook for

Introduction to Real Analysis

Authors: Robert G. Bartle, Donald R. Sherbert

4th edition

471433314, 978-1118135853, 1118135857, 978-1118135860, 1118135865, 978-0471433316

More Books

Students also viewed these Mathematics questions