Answered step by step
Verified Expert Solution
Question
1 Approved Answer
Spreadsheet eBook Suppose you have invested 2 5 % of your portfolio in each of four different stocks. The mean and standard deviation of the
Spreadsheet
eBook
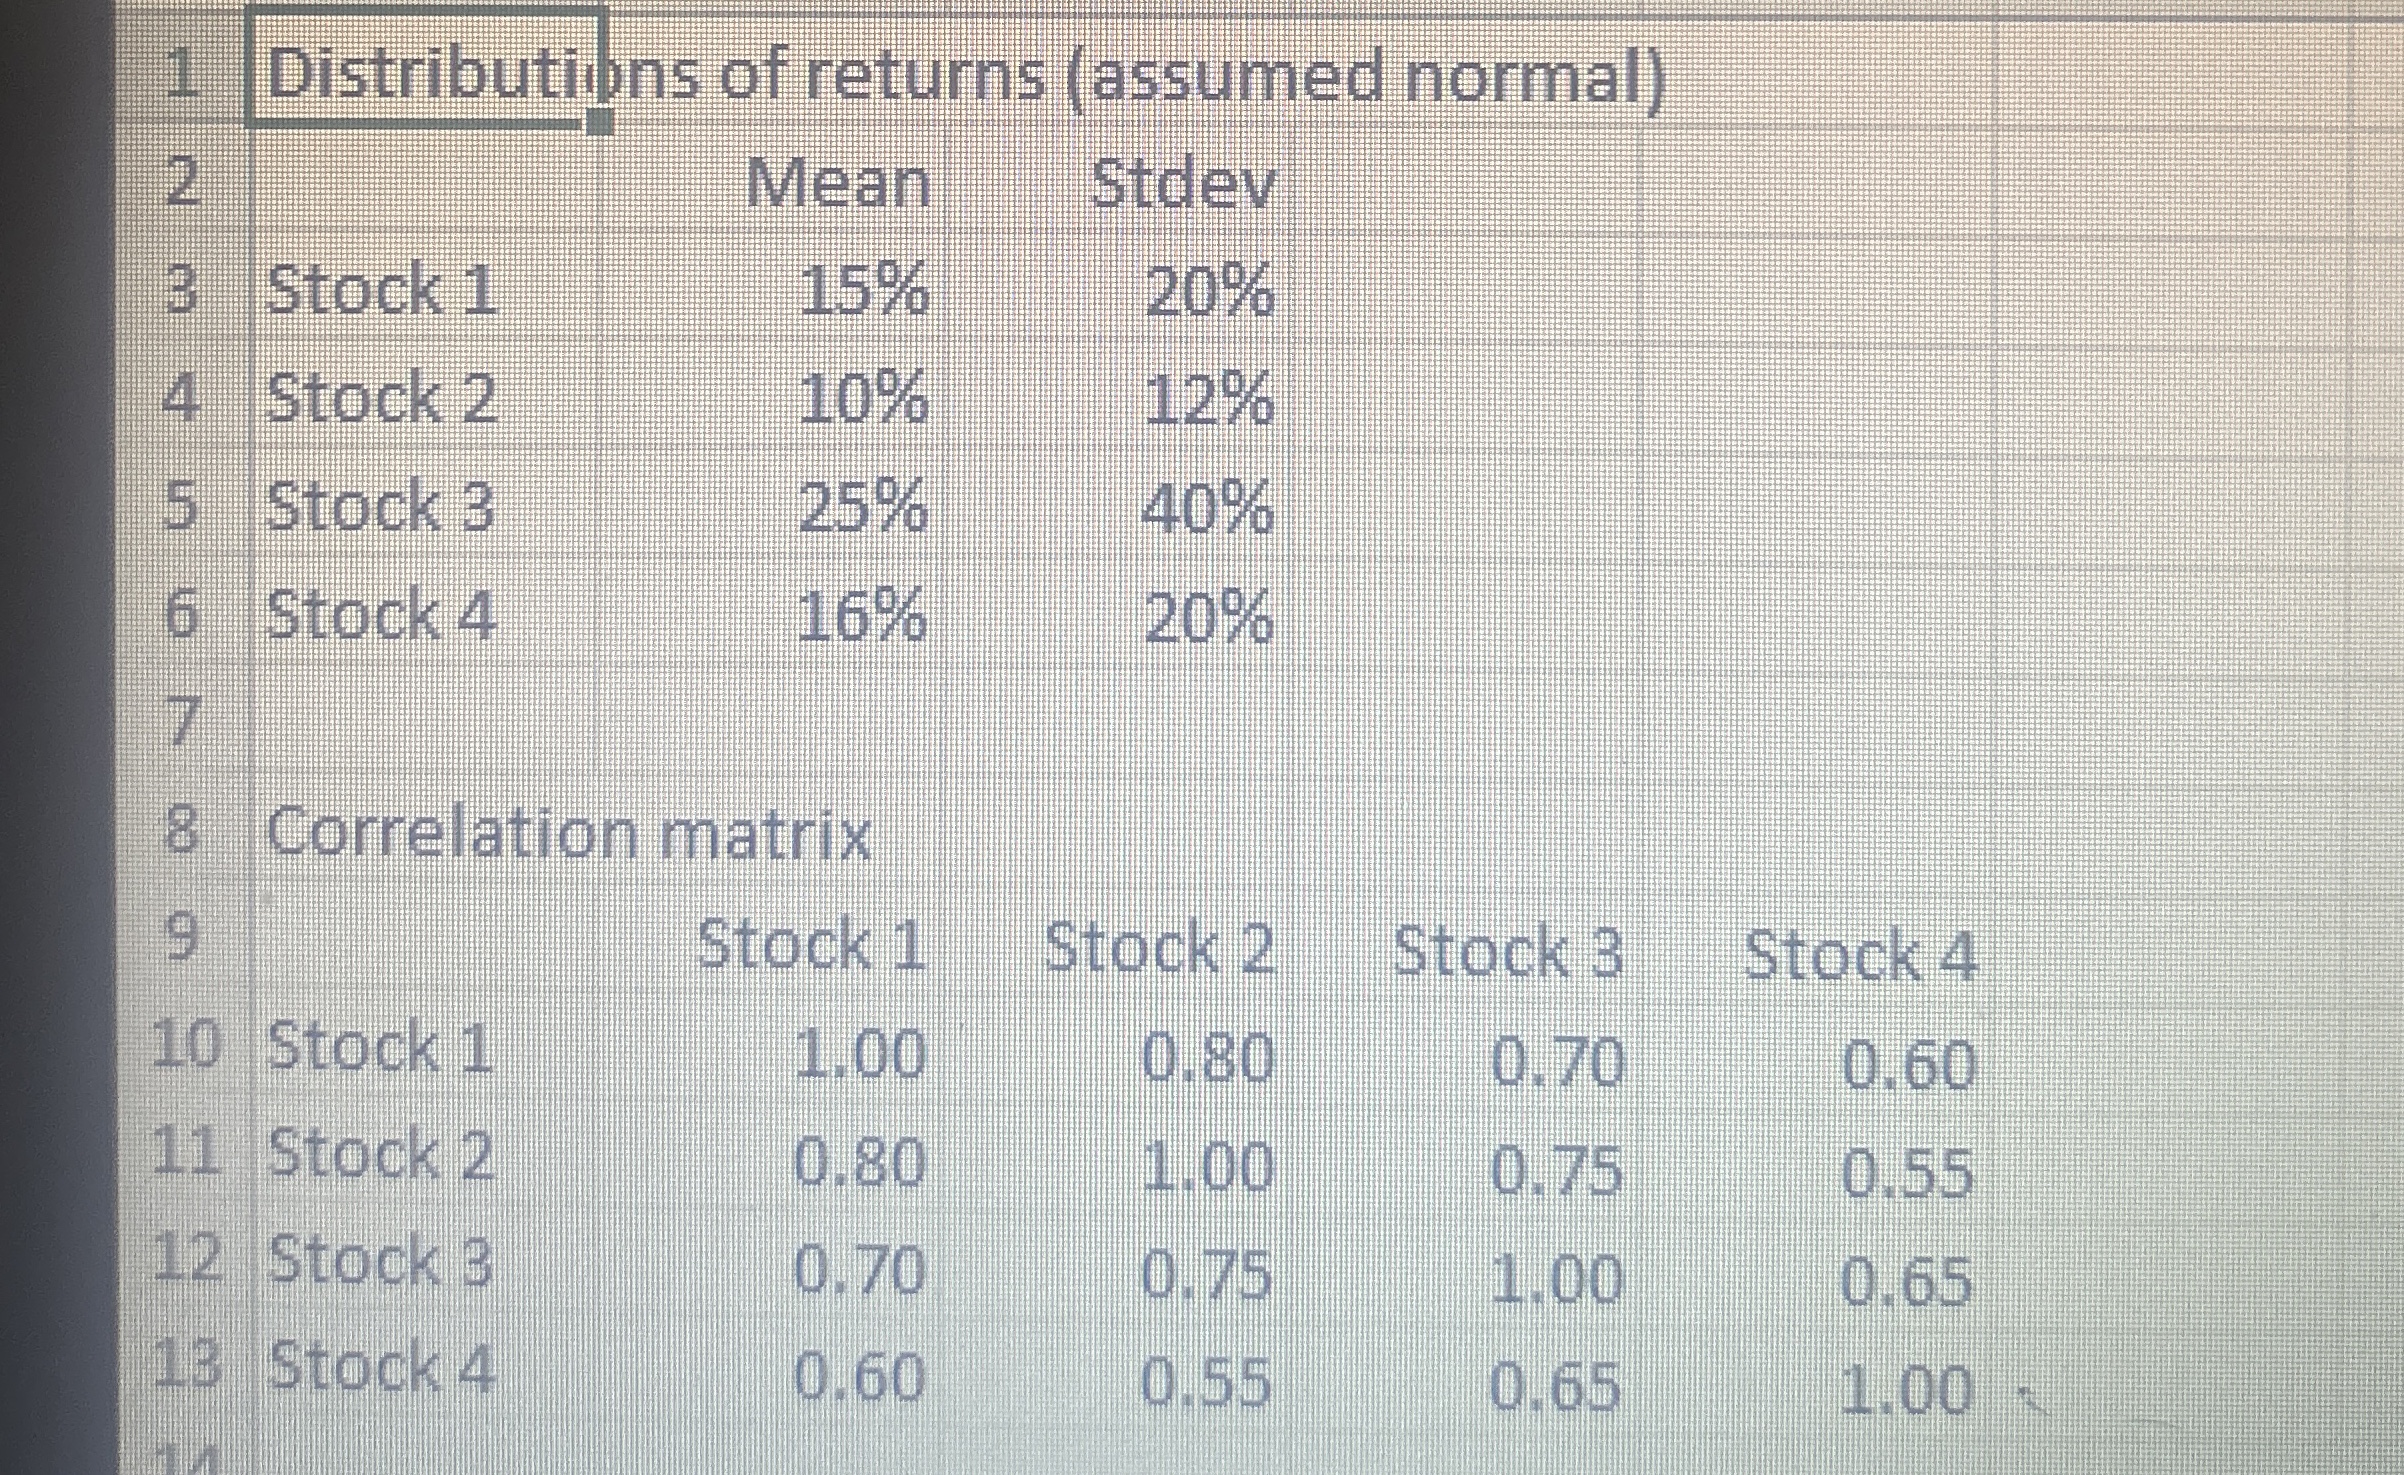
Suppose you have invested of your portfolio in each of four different stocks. The mean and standard deviation of the annual return on each stock are shown in the file Pxlsx The correlations between the annual returns on the four stocks are also shown in this file.
If necessary, round your answers to a whole percentage value.
a What is the probability that your portfolio's annual return will exceed
b What is the probability that your portfolio will lose money during the year?
Distributions of returns assumed normal
tableMean,Stdev,,Stock Stock Stock Stock Correlation matrixStock Stock Stock Stock Stock Stock Stock Stock

Step by Step Solution
There are 3 Steps involved in it
Step: 1

Get Instant Access to Expert-Tailored Solutions
See step-by-step solutions with expert insights and AI powered tools for academic success
Step: 2

Step: 3

Ace Your Homework with AI
Get the answers you need in no time with our AI-driven, step-by-step assistance
Get Started


