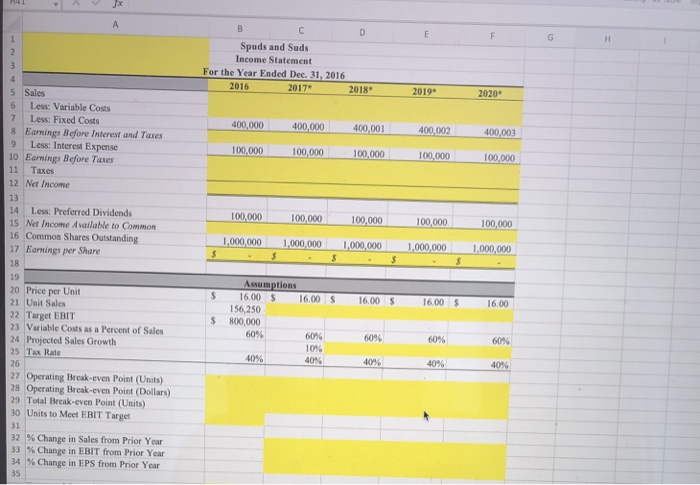
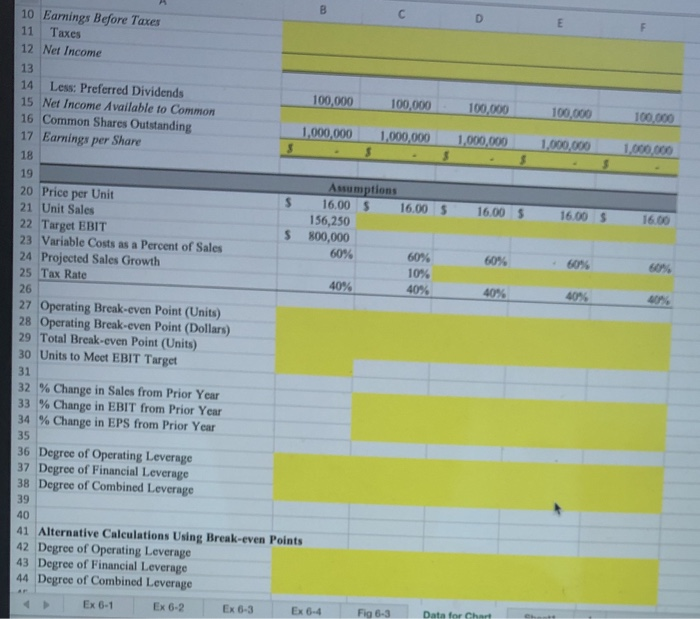
Spuds and Suds Income Statement or the Year Ended Dec. 31, 2016 2016 2017" 2018 2019 2020 400,000 400,000 400,001 400,002 400,003 5 Sales 6 Less: Variable Costs 7 Less: Fixed Costs 8 Earnings Before Interest and Taxes 9 Less: Interest Expense 10 Earnings Before Taxes 11 Taxes 12 Net Income 100.000 100.000 100.000 100.000 100.000 100 000 100.000 14 Less: Preferred Dividends 15 Net Income Available to Common 16 Common Shares Outstanding 17 Earnings per Share 1.000.000 1.000.000 1.000.00 1.000.000 1.000.000 16.00 16.00 16.00 20 Price per Unit 21 Unit Sales 22 Target EBIT 23 Variable Costs as a Percent of Sales 24 Projected Sales Growth 25 Tax Rate Assumptions 16.00 5 156,250 800,000 6096 GO 101 40% 4046 40% 40% 27 Operating Break-even Point (Units) 28 Operating Break-even Point (Dollars) 29 Total Break-even Point (Units) 30 Units to Meet EBIT Target 32 % Change in Sales from Prior Year 33 % Change in EBIT from Prior Year 34 % Change in EPS from Prior Year 10 Earnings Before Taxes 11 Taxes 12 Net Income 100,000 100.000 100.000 100.000 100.000 14 Less: Preferred Dividends 15 Net Income Available to Common 16 Common Shares Outstanding 17 Earnings per Share 1,000,000 1.000.000 1.000.000 1.000.000 1.000.000 18 $ $ 16.00 $ $ 20 Price per Unit 21 Unit Sales 22 Target EBIT 23 Variable Costs as a Percent of Sales 24 Projected Sales Growth 25 Tax Rate Assumptions 16,00 5 16.00 156,250 800,000 60% 60% 10 40% 60% 60% 4096 27 Operating Break-even Point (Units) 28 Operating Break-even Point (Dollars) 29 Total Break-even Point (Units) 30 Units to Meet EBIT Target 31 32 % Change in Sales from Prior Year 33 % Change in EBIT from Prior Year 34 % Change in EPS from Prior Year 35 36 Degree of Operating Leverage 37 Degree of Financial Leverage 38 Degree of Combined Leverage 41 Alternative Calculations Using Break-even Points 42 Degree of Operating Leverage 43 Degree of Financial Leverage 44 Degree of Combined Leverage Ex Ex 6-2 Fig 6.3 Data Spuds and Suds Income Statement or the Year Ended Dec. 31, 2016 2016 2017" 2018 2019 2020 400,000 400,000 400,001 400,002 400,003 5 Sales 6 Less: Variable Costs 7 Less: Fixed Costs 8 Earnings Before Interest and Taxes 9 Less: Interest Expense 10 Earnings Before Taxes 11 Taxes 12 Net Income 100.000 100.000 100.000 100.000 100.000 100 000 100.000 14 Less: Preferred Dividends 15 Net Income Available to Common 16 Common Shares Outstanding 17 Earnings per Share 1.000.000 1.000.000 1.000.00 1.000.000 1.000.000 16.00 16.00 16.00 20 Price per Unit 21 Unit Sales 22 Target EBIT 23 Variable Costs as a Percent of Sales 24 Projected Sales Growth 25 Tax Rate Assumptions 16.00 5 156,250 800,000 6096 GO 101 40% 4046 40% 40% 27 Operating Break-even Point (Units) 28 Operating Break-even Point (Dollars) 29 Total Break-even Point (Units) 30 Units to Meet EBIT Target 32 % Change in Sales from Prior Year 33 % Change in EBIT from Prior Year 34 % Change in EPS from Prior Year 10 Earnings Before Taxes 11 Taxes 12 Net Income 100,000 100.000 100.000 100.000 100.000 14 Less: Preferred Dividends 15 Net Income Available to Common 16 Common Shares Outstanding 17 Earnings per Share 1,000,000 1.000.000 1.000.000 1.000.000 1.000.000 18 $ $ 16.00 $ $ 20 Price per Unit 21 Unit Sales 22 Target EBIT 23 Variable Costs as a Percent of Sales 24 Projected Sales Growth 25 Tax Rate Assumptions 16,00 5 16.00 156,250 800,000 60% 60% 10 40% 60% 60% 4096 27 Operating Break-even Point (Units) 28 Operating Break-even Point (Dollars) 29 Total Break-even Point (Units) 30 Units to Meet EBIT Target 31 32 % Change in Sales from Prior Year 33 % Change in EBIT from Prior Year 34 % Change in EPS from Prior Year 35 36 Degree of Operating Leverage 37 Degree of Financial Leverage 38 Degree of Combined Leverage 41 Alternative Calculations Using Break-even Points 42 Degree of Operating Leverage 43 Degree of Financial Leverage 44 Degree of Combined Leverage Ex Ex 6-2 Fig 6.3 Data