srj1 please answer. thanks
i
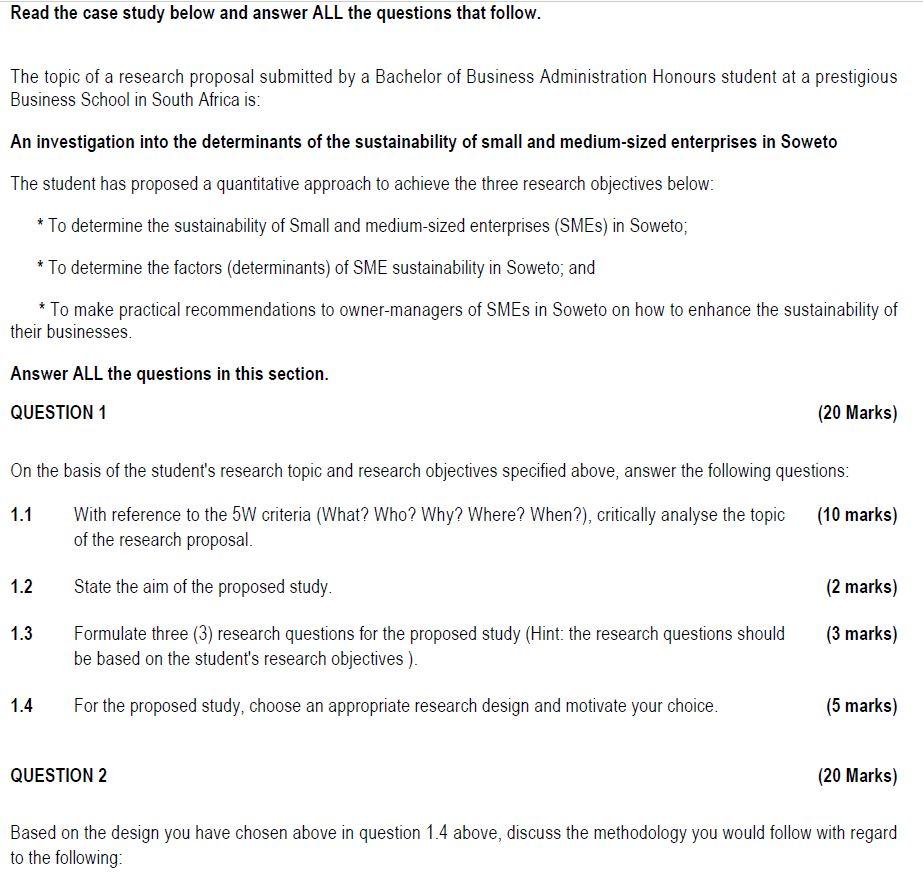
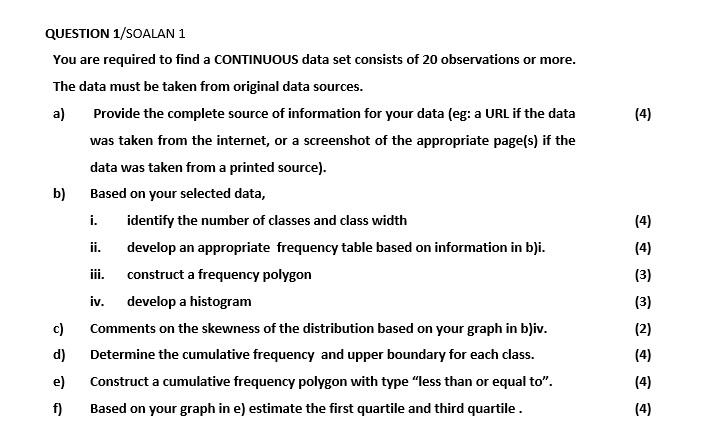
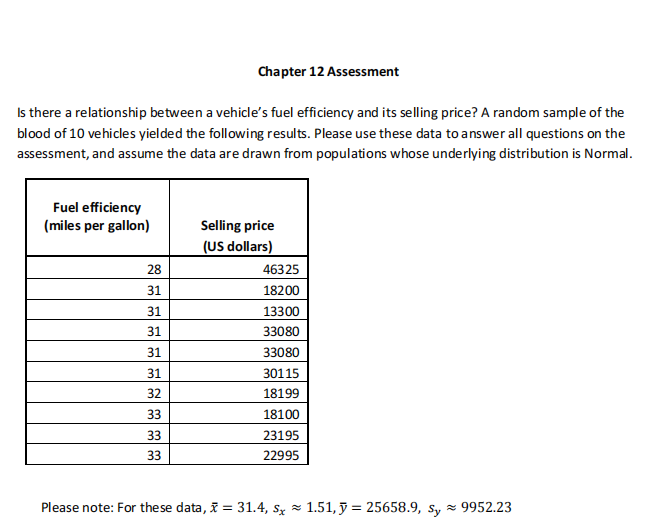
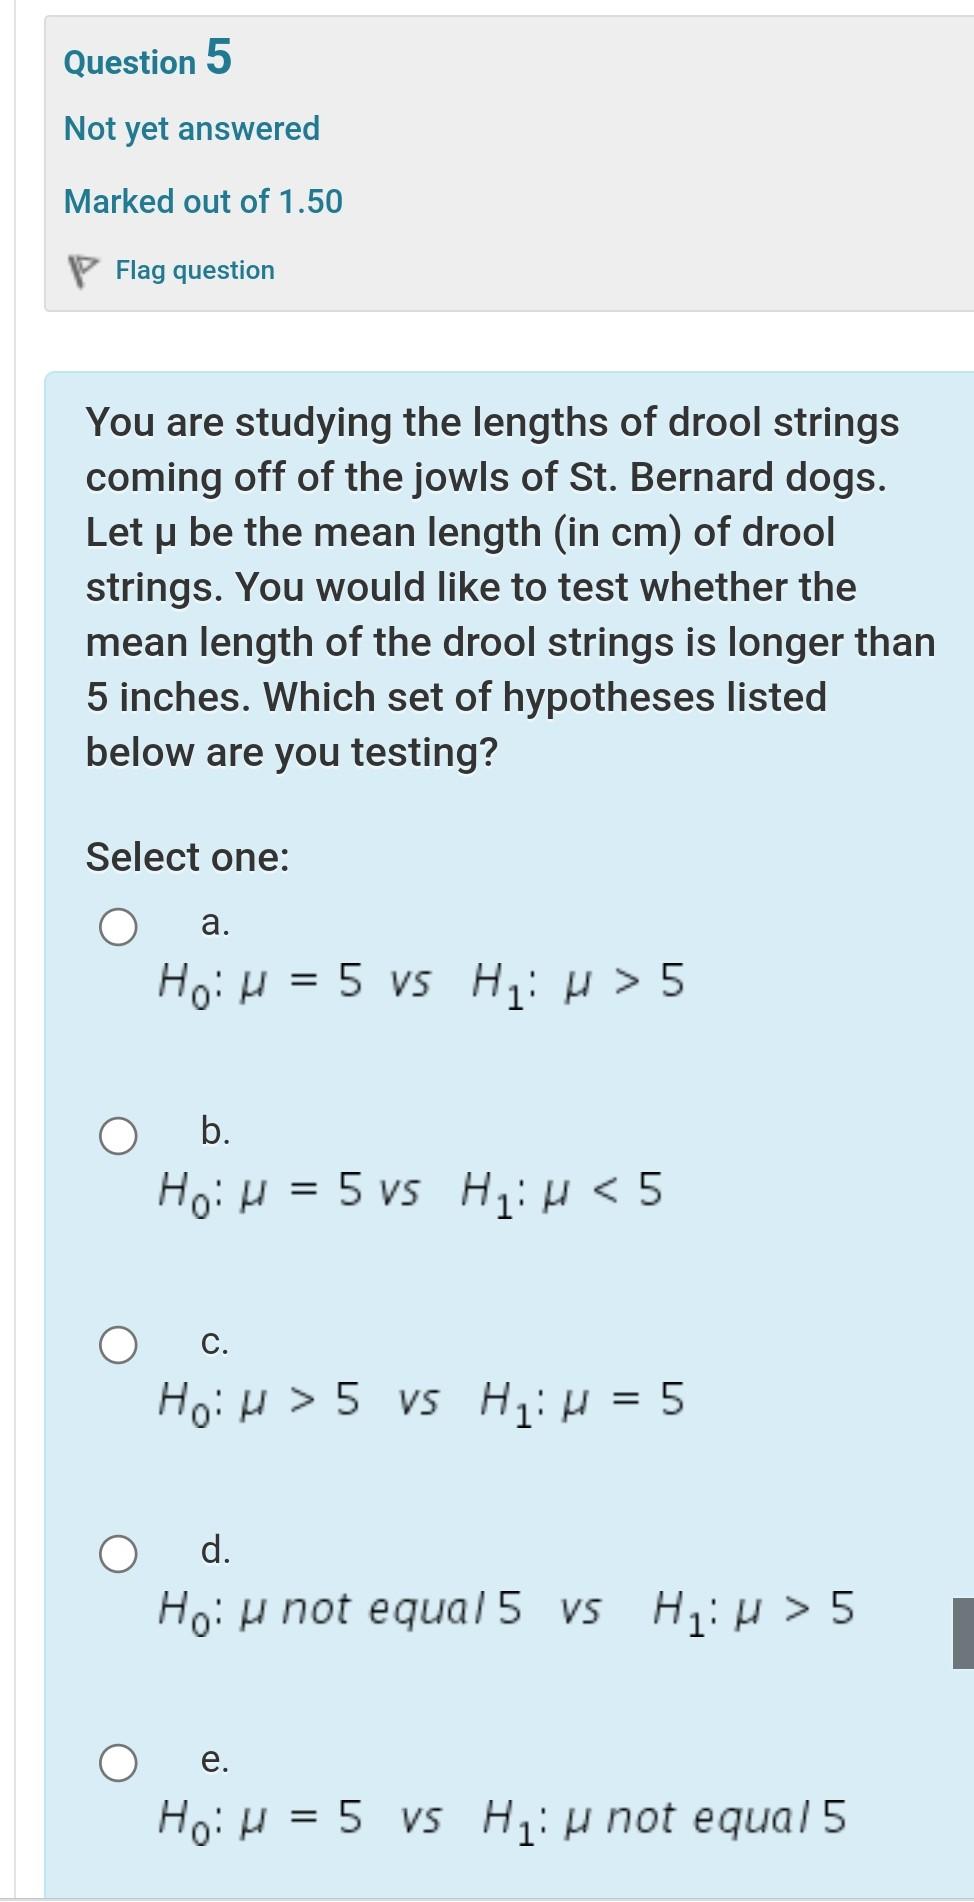
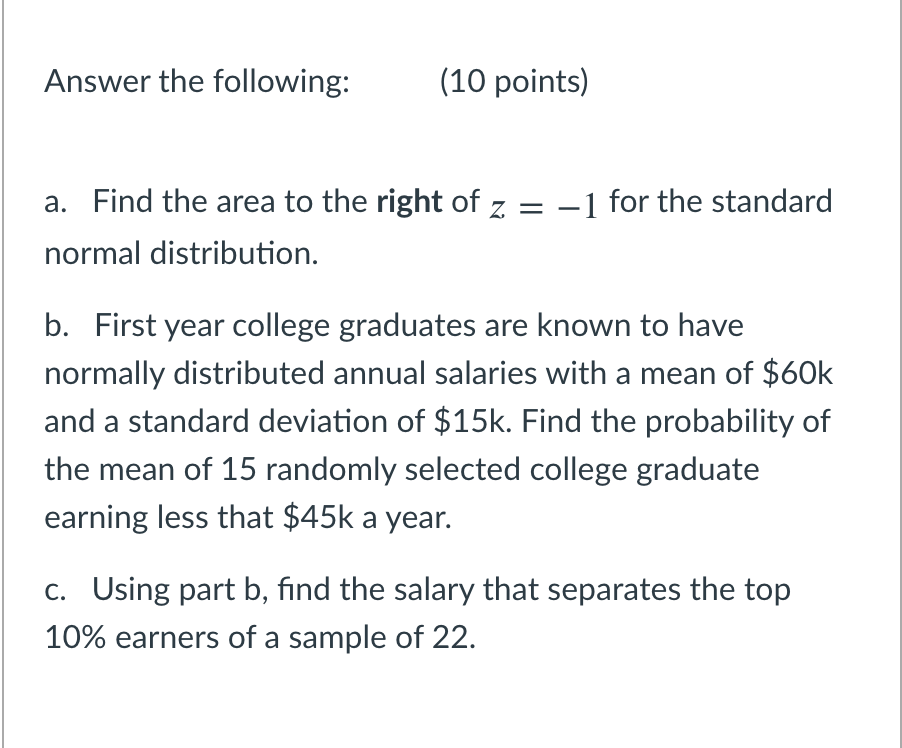
Stead-the case study below and answer Kathe questions that tollow. The topic of a research proposal submitted by a Bachelor of Business Administration Honours student at a prestigious Business School in South Africa is: An investigation into the determinants of the sustainability of small and medium-sized enterprises in Soweto The student has proposed a quantitative approach to achieve the three research objectives below: * To determine the sustainability of Small and mediumsized enterprises (SMEsl in Soweto; * To determine the factors (determinants) of 3?le sustainability in Soweto; and * To make practical recommendations to owner-managers of SMEs in Soweto on how to enhance the sustainability of their businesses. Answer ALL the questions in this section. QUESTION 1 (2!? Marks] On the basis of the student's research topic and research objectives specified above, answer the following questions: 1.1 With reterence to the SW criteria (What? Who? Why? Where? When?], critically analyse the topic {10 marks] of the research proposal. 1.2 State the aim of the proposed study. {2 marks] 1.3 Formuiate three (3] research questions for the proposed study (Hint: the research questions should {3 marks] be based on the student's research objectives ]. 1.4 For the proposed study, choose an appropriate research design and motivate your choice. {5 marks] QUESTION 2 (2t) Marks] Based on the design you have chosen above in question 1.4 above, discuss the methodology you would foiiow with regard to the following: QUESTION 1/SOALAN 1 You are required to find a CONTINUOUS data set consists of 20 observations or more. The data must be taken from original data sources. a) Provide the complete source of information for your data (eg: a URL if the data (4) was taken from the internet, or a screenshot of the appropriate page(s) if the data was taken from a printed source). b) Based on your selected data, i. identify the number of classes and class width ii. develop an appropriate frequency table based on information in b)i. iii. construct a frequency polygon iv. develop a histogram C) Comments on the skewness of the distribution based on your graph in bliv. d) Determine the cumulative frequency and upper boundary for each class. e) Construct a cumulative frequency polygon with type "less than or equal to". f) Based on your graph in e) estimate the first quartile and third quartile .Please note. for these data, A I. 1, 1. (5 points) Find the equation of the least-squares line: p = a + bx. Round your results to two decimal places.Chapter 12 Assessment Is there a relationship between a vehicle's fuel efficiency and its selling price? A random sample of the blood of 10 vehicles yielded the following results. Please use these data to answer all questions on the assessment, and assume the data are drawn from populations whose underlying distribution is Normal. Fuel efficiency (miles per gallon) Selling price (US dollars) 28 46325 31 18200 31 13300 31 33080 31 33080 31 301 15 32 18199 33 18100 33 23195 33 22995 Please note: For these data, x = 31.4, Sx = 1.51, y = 25658.9, sy = 9952.23Question 5 Not yet answered Marked out of 1.50 '7 Flag question You are studying the lengths of drool strings coming off of the jowls of St. Bernard dogs. Let u be the mean length (in cm) of drool strings. You would like to test whether the mean length of the drool strings is longer than 5 inches. Which set of hypotheses listed below are you testing? Select one: Q a. H0:p=5vs lep>5 O b. Hozp=5vs H1:p5 vs H1:p=5 Q d. Ho: u not equal 5 vs H1: p > 5 0 e. Ho: u = 5 vs H1: pnot equalS Answer the following: (10 points) a. Find the area to the right of z = _1 for the standard normal distribution. b. First year college graduates are known to have normally distributed annual salaries with a mean of $60k and a standard deviation of $15k. Find the probability of the mean of 15 randomly selected college graduate earning less that $45k a year. c. Using part b, nd the salary that separates the top 10% earners of a sample of 22
