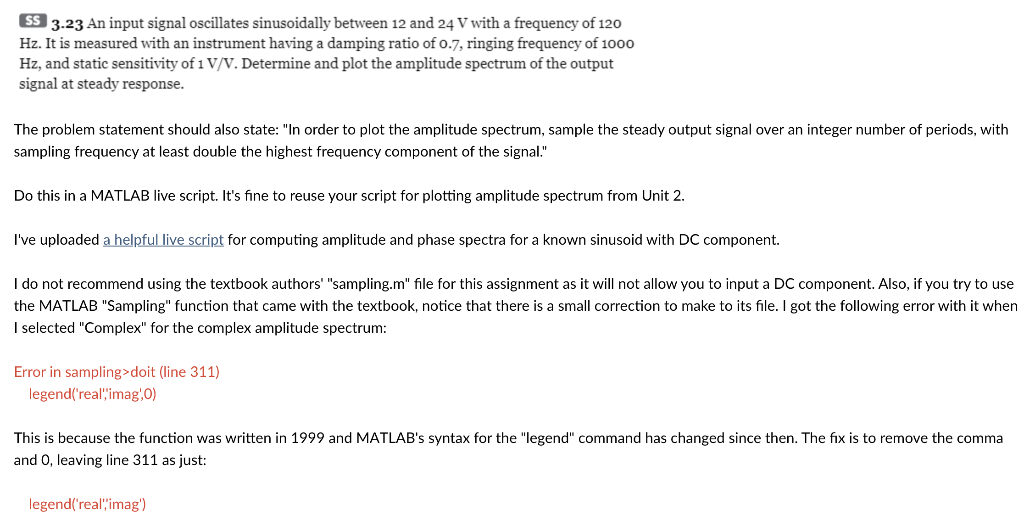
SS 3.23 An input signal oscillates sinusoidally between 12 and 24 V with a frequency of 120 Hz. It is measured with an instrument having a damping ratio of 0.7, ringing frequency of 1000 Hz, and static sensitivity of 1 V/V. Determine and plot the amplitude spectrum of the output signal at steady response. The problem statement should also state: "In order to plot the amplitude spectrum, sample the steady output signal over an integer number of periods, with sampling frequency at least double the highest frequency component of the signal." Do this in a MATLAB live script. It's fine to reuse your script for plotting amplitude spectrum from Unit 2. I've uploaded a helpful live script for computing amplitude and phase spectra for a known sinusoid with DC component. I do not recommend using the textbook authors' "sampling.m" file for this assignment as it will not allow you to input a DC component. Also, if you try to use the MATLAB "Sampling" function that came with the textbook, notice that there is a small correction to make to its file. I got the following error with it when I selected "Complex" for the complex amplitude spectrum: Error in sampling>doit (line 311) legend('real'imag,0) This is because the function was written in 1999 and MATLAB's syntax for the "legend" command has changed since then. The fix is to remove the comma and 0, leaving line 311 as just: legend('real'imag') SS 3.23 An input signal oscillates sinusoidally between 12 and 24 V with a frequency of 120 Hz. It is measured with an instrument having a damping ratio of 0.7, ringing frequency of 1000 Hz, and static sensitivity of 1 V/V. Determine and plot the amplitude spectrum of the output signal at steady response. The problem statement should also state: "In order to plot the amplitude spectrum, sample the steady output signal over an integer number of periods, with sampling frequency at least double the highest frequency component of the signal." Do this in a MATLAB live script. It's fine to reuse your script for plotting amplitude spectrum from Unit 2. I've uploaded a helpful live script for computing amplitude and phase spectra for a known sinusoid with DC component. I do not recommend using the textbook authors' "sampling.m" file for this assignment as it will not allow you to input a DC component. Also, if you try to use the MATLAB "Sampling" function that came with the textbook, notice that there is a small correction to make to its file. I got the following error with it when I selected "Complex" for the complex amplitude spectrum: Error in sampling>doit (line 311) legend('real'imag,0) This is because the function was written in 1999 and MATLAB's syntax for the "legend" command has changed since then. The fix is to remove the comma and 0, leaving line 311 as just: legend('real'imag')


