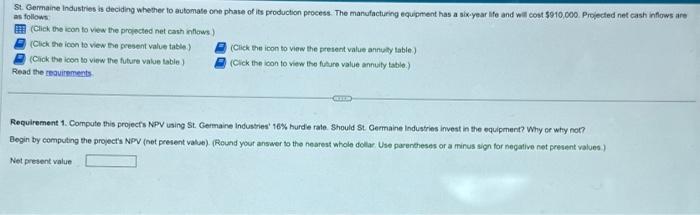
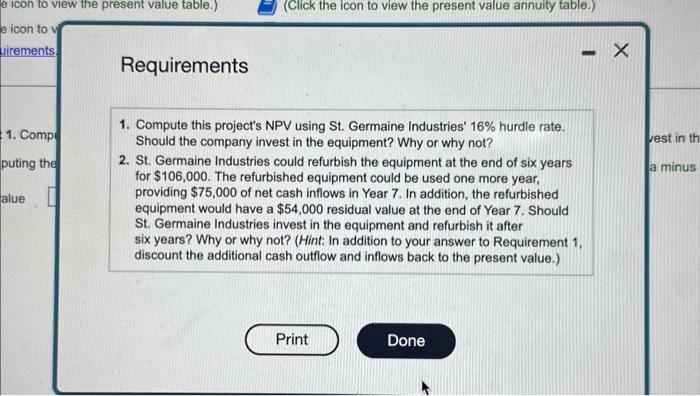
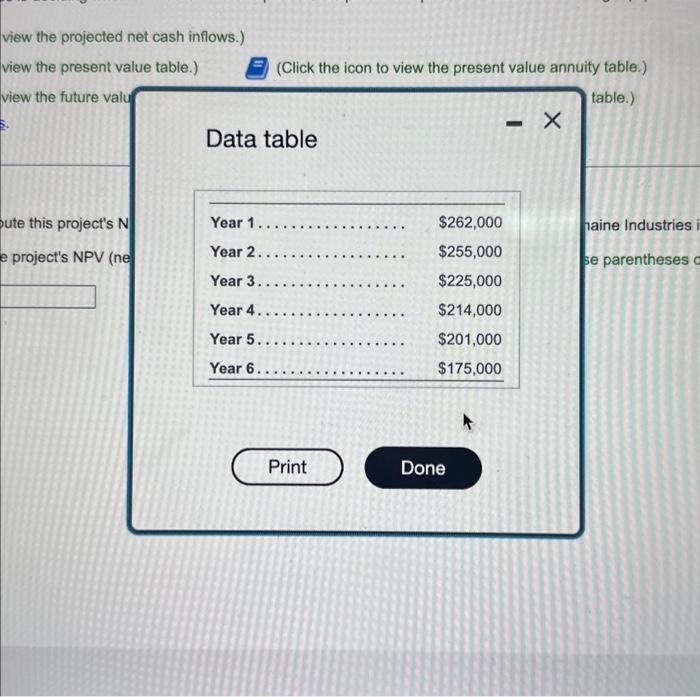
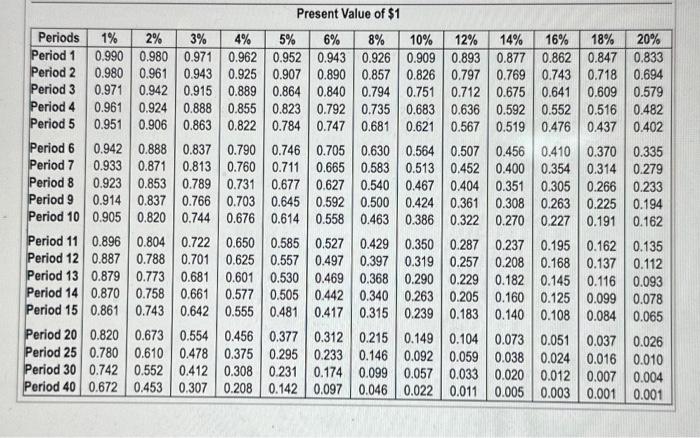
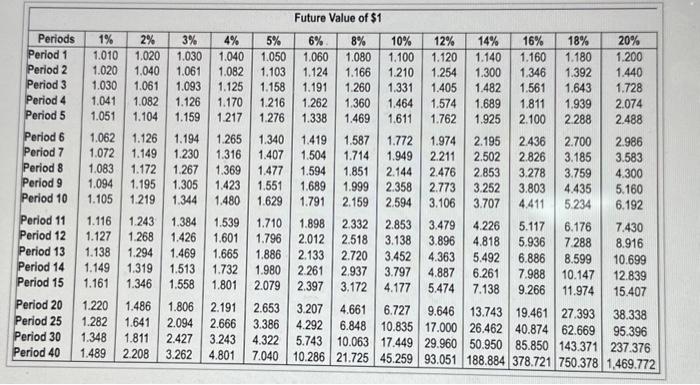
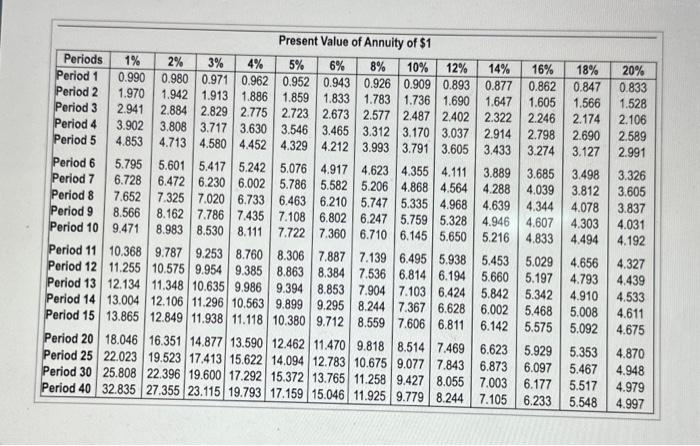
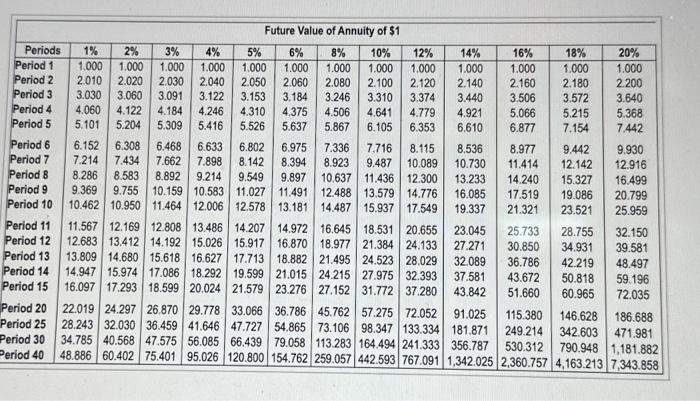
St. Germaine industries is decidhg whether to automate one phate of its production peocess. The manufacturing equiptrent has a six-year lfe and wit cont 5910,000 Proiected net cash inflows are as follows (Click the ican to view the proiected net cash inflows) (Click the icon to view the present value table) (Click the icon to view the present value annuly lable) (Cick the icon to view the future value table) Read the reouirements. (Cick the icon to view the fiture value annuity tablo.) Requirement 1. Compute this projecfs NpY using St. Gemaine Industres' 16% hurde rate. Should St Germaine industries invest in the equipment? Why or why nor? Begin by computing the propect's NPV (net present value). (Round yout answer to the nearest whole dollar Use parencheses or a mirus sign for negative net present values) Net present value Requirements 1. Compute this project's NPV using St. Germaine Industries' 16% hurdle rate. Should the company invest in the equipment? Why or why not? 2. St. Germaine Industries could refurbish the equipment at the end of six years for $106,000. The refurbished equipment could be used one more year, providing $75,000 of net cash inflows in Year 7 . In addition, the refurbished equipment would have a $54,000 residual value at the end of Year 7 . Should St. Germaine Industries invest in the equipment and refurbish it after six years? Why or why not? (Hint: In addition to your answer to Requirement 1 , discount the additional cash outflow and inflows back to the present value.) view the projected net cash inflows.) view the present value table.) (Click the icon to view the present value annuity table.) view the future valu table.) Data table ute this project's N haine Industries project's NPV (ne se parentheses Present Value of $1 Future Value of $1 Present Value of Annuity of $1 \begin{tabular}{|l|c|c|c|c|c|c|c|c|c|c|c|c|c|} \hline Periods & 1% & 2% & 3% & 4% & 5% & 6% & 8% & 10% & 12% & 14% & 16% & 18% & 20% \\ \hline Period 1 & 0.990 & 0.980 & 0.971 & 0.962 & 0.952 & 0.943 & 0.926 & 0.909 & 0.893 & 0.877 & 0.862 & 0.847 & 0.833 \\ Period 2 & 1.970 & 1.942 & 1.913 & 1.886 & 1.859 & 1.833 & 1.783 & 1.736 & 1.690 & 1.647 & 1.605 & 1.566 & 1.528 \\ Period 3 & 2.941 & 2.884 & 2.829 & 2.775 & 2.723 & 2.673 & 2.577 & 2.487 & 2.402 & 2.322 & 2.246 & 2.174 & 2.106 \\ Period 4 & 3.902 & 3.808 & 3.717 & 3.630 & 3.546 & 3.465 & 3.312 & 3.170 & 3.037 & 2.914 & 2.798 & 2.690 & 2.589 \\ Period 5 & 4.853 & 4.713 & 4.580 & 4.452 & 4.329 & 4.212 & 3.993 & 3.791 & 3.605 & 3.433 & 3.274 & 3.127 & 2.991 \\ Period 6 & 5.795 & 5.601 & 5.417 & 5.242 & 5.076 & 4.917 & 4.623 & 4.355 & 4.111 & 3.889 & 3.685 & 3.498 & 3.326 \\ Period 7 & 6.728 & 6.472 & 6.230 & 6.002 & 5.786 & 5.582 & 5.206 & 4.868 & 4.564 & 4.288 & 4.039 & 3.812 & 3.605 \\ Period 8 & 7.652 & 7.325 & 7.020 & 6.733 & 6.463 & 6.210 & 5.747 & 5.335 & 4.968 & 4.639 & 4.344 & 4.078 & 3.837 \\ Period 9 & 8.566 & 8.162 & 7.786 & 7.435 & 7.108 & 6.802 & 6.247 & 5.759 & 5.328 & 4.946 & 4.607 & 4.303 & 4.031 \\ Period 10 & 9.471 & 8.983 & 8.530 & 8.111 & 7.722 & 7.360 & 6.710 & 6.145 & 5.650 & 5.216 & 4.833 & 4.494 & 4.192 \\ Period 11 & 10.368 & 9.787 & 9.253 & 8.760 & 8.306 & 7.887 & 7.139 & 6.495 & 5.938 & 5.453 & 5.029 & 4.656 & 4.327 \\ Period 12 & 11.255 & 10.575 & 9.954 & 9.385 & 8.863 & 8.384 & 7.536 & 6.814 & 6.194 & 5.660 & 5.197 & 4.793 & 4.439 \\ Period 13 & 12.134 & 11.348 & 10.635 & 9.986 & 9.394 & 8.853 & 7.904 & 7.103 & 6.424 & 5.842 & 5.342 & 4.910 & 4.533 \\ Period 14 & 13.004 & 12.106 & 11.296 & 10.563 & 9.899 & 9.295 & 8.244 & 7.367 & 6.628 & 6.002 & 5.468 & 5.008 & 4.611 \\ Period 15 & 13.865 & 12.849 & 11.938 & 11.118 & 10.380 & 9.712 & 8.559 & 7.606 & 6.811 & 6.142 & 5.575 & 5.092 & 4.675 \\ Period 20 & 18.046 & 16.351 & 14.877 & 13.590 & 12.462 & 11.470 & 9.818 & 8.514 & 7.469 & 6.623 & 5.929 & 5.353 & 4.870 \\ Period 25 & 22.023 & 19.523 & 17.413 & 15.622 & 14.094 & 12.783 & 10.675 & 9.077 & 7.843 & 6.873 & 6.097 & 5.467 & 4.948 \\ Period 30 & 25.808 & 22.396 & 19.600 & 17.292 & 15.372 & 13.765 & 11.258 & 9.427 & 8.055 & 7.003 & 6.177 & 5.517 & 4.979 \\ Period 40 & 32.835 & 27.355 & 23.115 & 19.793 & 17.159 & 15.046 & 11.925 & 9.779 & 8.244 & 7.105 & 6.233 & 5.548 & 4.997 \\ \hline \end{tabular} Future Value of Annuity of $1