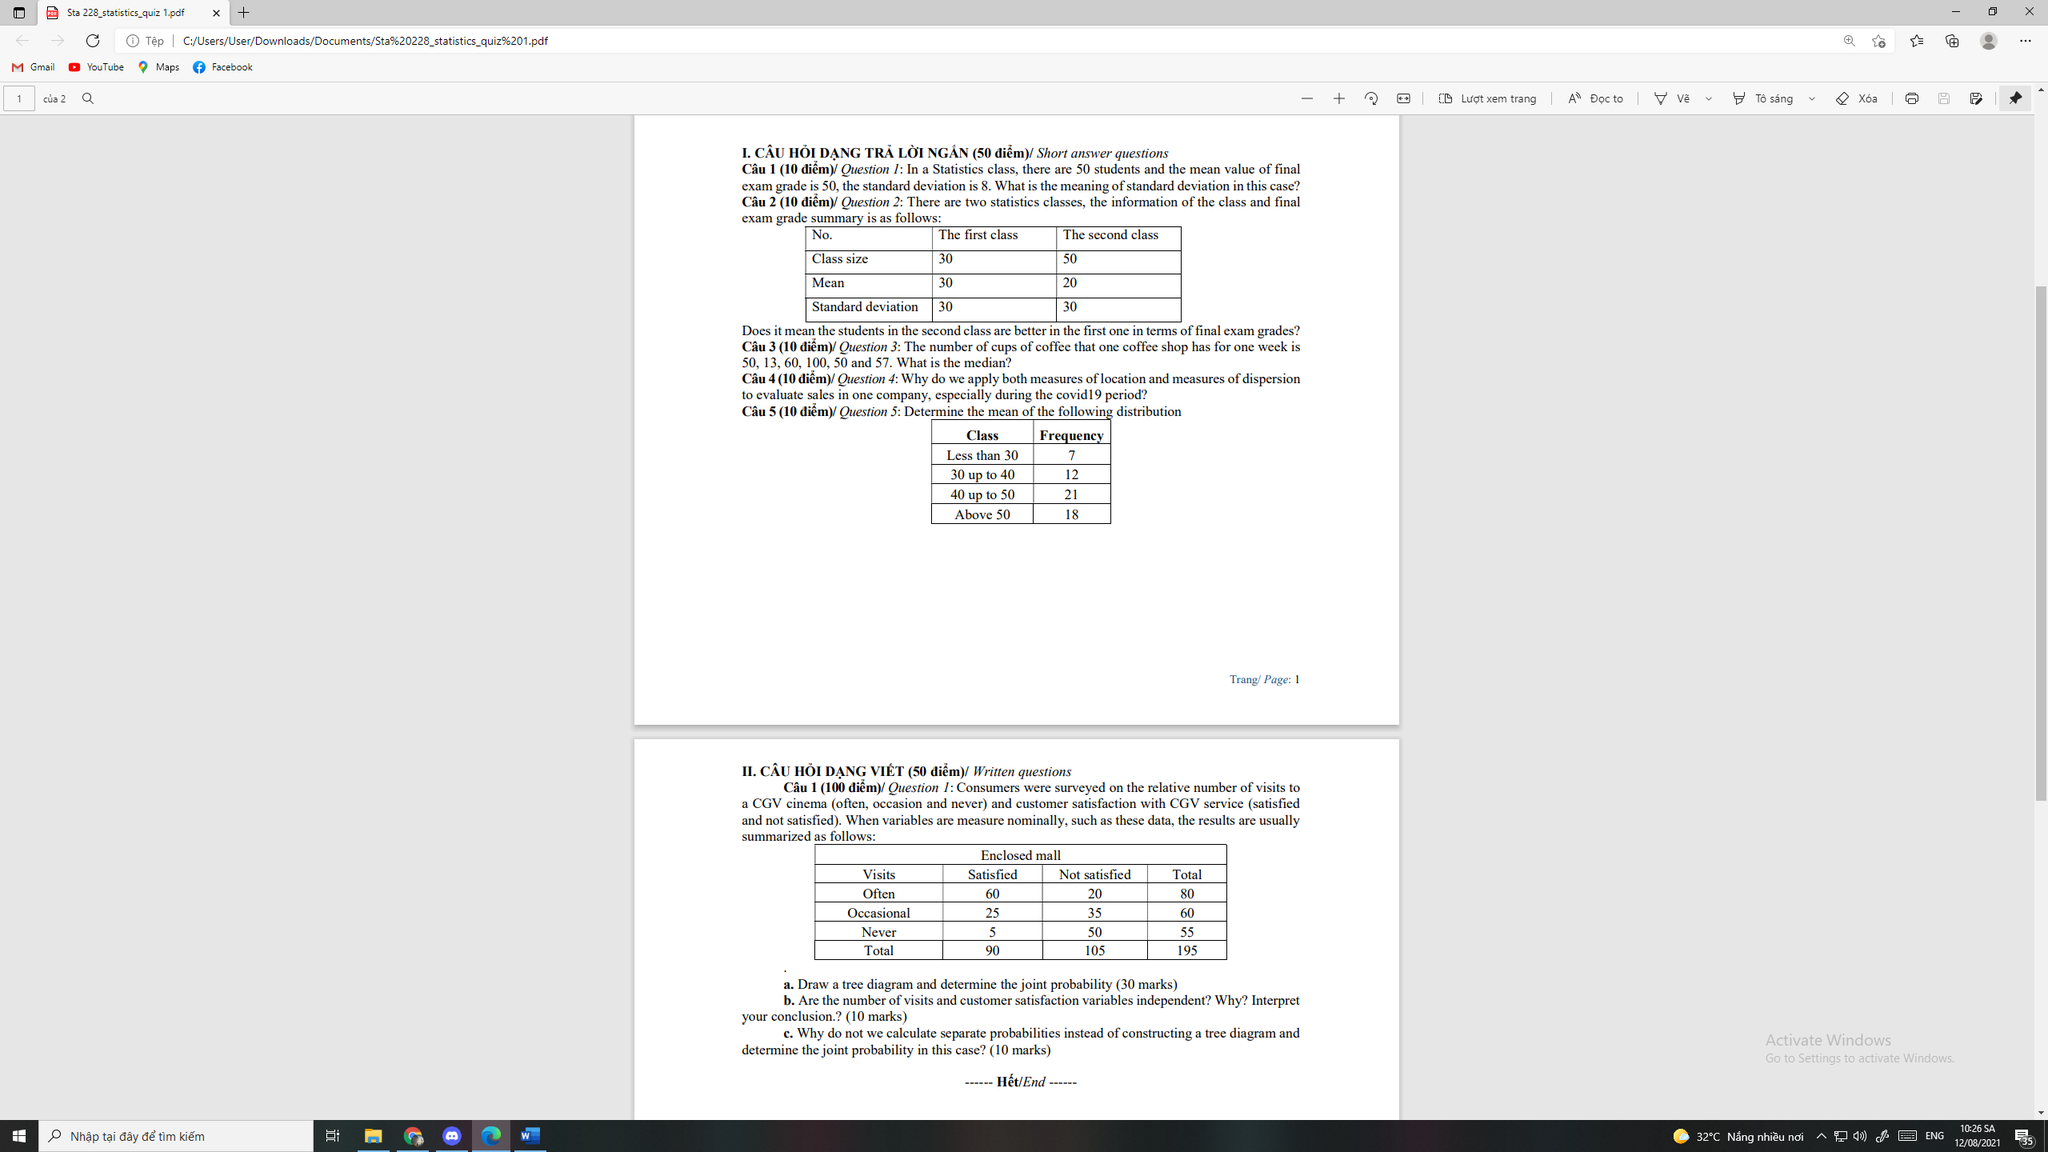
Sta 228_statistics_quiz 1.pdf * + G Tep | C:/Users/User/Downloads/Documents/Sta%20228_statistics_quiz%201.pdf ... M Gmail @ YouTube ) Maps f Facebook 1 cua 2 Q - + | Lugt xem trang | A Docto | V ve To sang " ( X6: | 9 I. CAU HOI DANG TRA LOI NGAN (50 diem)/ Short answer questions Cau 1 (10 diem)/ Question 1: In a Statistics class, there are 50 students and the mean value of final exam grade is 50, the standard deviation is 8. What is the meaning of standard deviation in this case? Cau 2 (10 diem)/ Question 2: There are two statistics classes, the information of the class and final exam grade summary is as follows: No. The first class The second class Class size 30 50 Mean 30 20 Standard deviation 30 30 Does it mean the students in the second class are better in the first one in terms of final exam grades? Cau 3 (10 diem)/ Question 3: The number of cups of coffee that one coffee shop has for one week is 50, 13, 60, 100, 50 and 57. What is the median? Cau 4 (10 diem)/ Question 4: Why do we apply both measures of location and measures of dispersion to evaluate sales in one company, especially during the covid19 period? Cau 5 (10 diem)/ Question 5: Determine the mean of the following distribution Class Frequency Less than 30 30 up to 40 12 40 up to 50 21 Above 50 18 Trang/ Page: 1 II. CAU HOI DANG VIET (50 diem)/ Written questions Cau 1 (100 diem)/ Question 1: Consumers were surveyed on the relative number of visits to a CGV cinema (often, occasion and never) and customer satisfaction with CGV service (satisfied and not satisfied). When variables are measure nominally, such as these data, the results are usually summarized as follows: Enclosed mall Visits Satisfied Not satisfied Total Often 60 20 80 Occasional 25 35 60 Never 50 55 Total 90 105 195 a. Draw a tree diagram and determine the joint probability (30 marks) b. Are the number of visits and customer satisfaction variables independent? Why? Interpret your conclusion.? (10 marks) c. Why do not we calculate separate probabilities instead of constructing a tree diagram and determine the joint probability in this case? (10 marks) Activate Windows Go to Settings to activate Windows. -----" Het/End --..-- Nhap tai day de tim kiem 32*C Nang nhieu noi ~ $ 4) ENG 12 10:26 SA 12/08/2021


