Answered step by step
Verified Expert Solution
Question
1 Approved Answer
= = = Standard Income Statement Financial Statements in CAD Dollars Using the numbers from the two income statements, fill in the percentages calculated

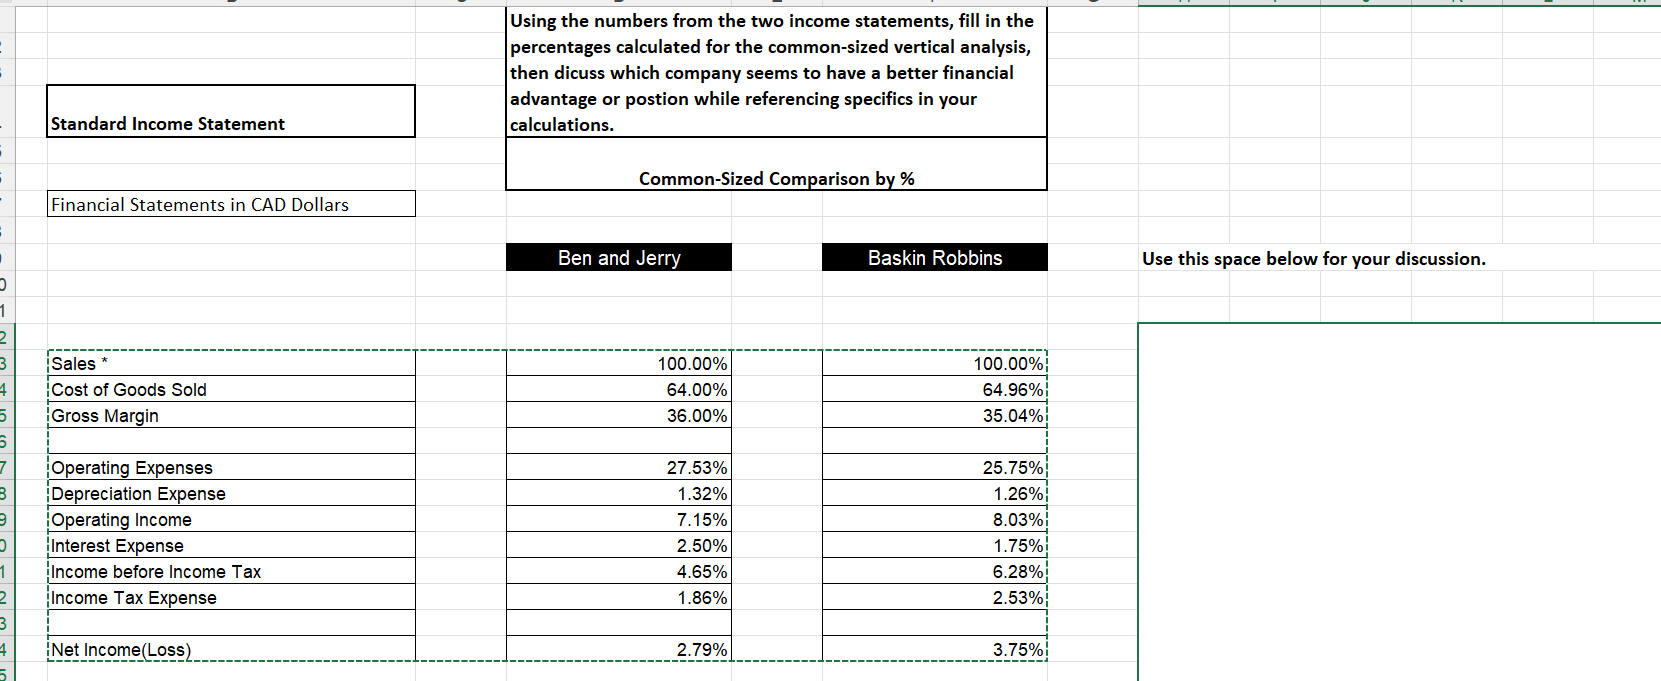
= = = Standard Income Statement Financial Statements in CAD Dollars Using the numbers from the two income statements, fill in the percentages calculated for the common-sized vertical analysis, then dicuss which company seems to have a better financial advantage or postion while referencing specifics in your calculations. Common-Sized Comparison by % Ben and Jerry Baskin Robbins Use this space below for your discussion. 1 2 3 Sales * 4 Cost of Goods Sold 5 Gross Margin 100.00% 100.00% 64.00% 64.96% 36.00% 35.04% 6 7 Operating Expenses 27.53% 25.75% 8 Depreciation Expense 1.32% 1.26% Operating Income 7.15% 8.03% Interest Expense 2.50% 1.75% 1 Income before Income Tax 4.65% 6.28% 2 Income Tax Expense 1.86% 2.53% 3 4 Net Income (Loss). 2.79% 3.75% 5.
Step by Step Solution
There are 3 Steps involved in it
Step: 1

Get Instant Access to Expert-Tailored Solutions
See step-by-step solutions with expert insights and AI powered tools for academic success
Step: 2

Step: 3

Ace Your Homework with AI
Get the answers you need in no time with our AI-driven, step-by-step assistance
Get Started


