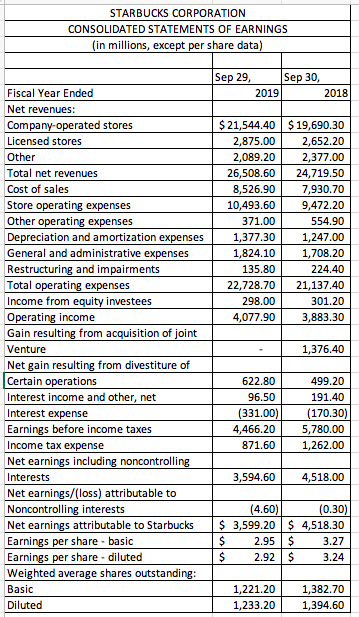
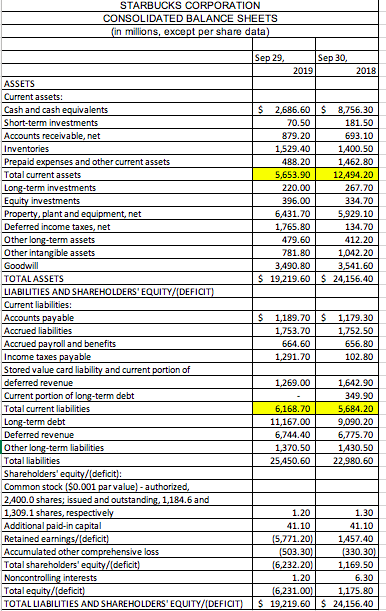
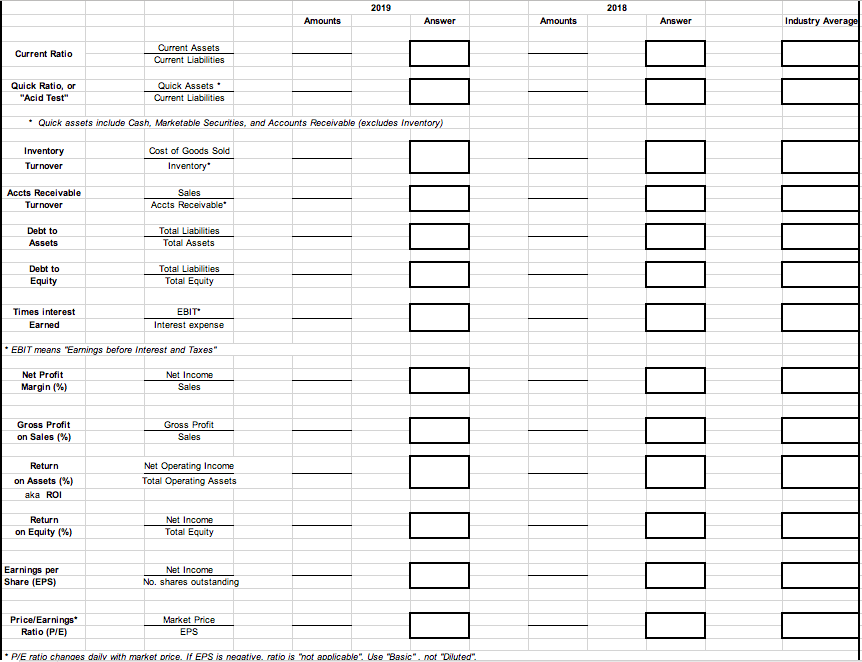
STARBUCKS CORPORATION CONSOLIDATED STATEMENTS OF EARNINGS (in millions, except per share data) Sep 29, Sep 30, 2019 2018 $ 21,544.40 2,875.00 2,089.20 26,508.60 8,526.90 10,493.60 371.00 1,377.30 1,824.10 135.80 22,728.70 298.00 4,077.90 $ 19,690.30 2,652.20 2,377.00 24,719.50 7,930.70 9,472.20 554.90 1,247.00 1,708.20 224.40 21,137.40 301.20 3,883.30 Fiscal Year Ended Net revenues: Company operated stores Licensed stores Other Total net revenues Cost of sales Store operating expenses Other operating expenses Depreciation and amortization expenses General and administrative expenses 1 Restructuring and impairments Total operating expenses Income from equity investees Operating income Gain resulting from acquisition of joint Venture Net gain resulting from divestiture of Certain operations Interest income and other, net Interest expense Earnings before income taxes Income tax expense Net earnings including noncontrolling Interests Net earnings/(loss) attributable to Noncontrolling interests Net earnings attributable to Starbucks Earnings per share - basic Earnings per share - diluted Weighted average shares outstanding: Basic Diluted 1,376.40 622.80 96.50 (331.00) 4,466.20 871.60 499.20 191.40 (170.30) 5,780.00 1.262.00 3,594.60 4,518.00 (4.60)| (0.30) $ 3,599.20 $ 4,518.30 $ 2.95 $ 3.27 $ 2.92 $ 3.24 1,221.20 1,233.20 1,382.70 1,394.60 STARBUCKS CORPORATION CONSOLIDATED BALANCE SHEETS fin millions, except per share data) Sep 29 Sep 30, 2019 2018 $ $ 2686.60 70. SO 879.20 1.529.40 5.653.90 220.00 396.00 6431.705 1,765.80 479.60 781.80 3.490.80 19.219.60 $ 8,756.30 181 693.10 1400.50 1462.80 12.494.20 267.70 334.70 ,929.10 134.70 412.20 1,042.20 3,541.60 24.156.40 $ S 1179 20 ASSETS Current assets Cash and cash equivalents Short-term investments Accounts receivable.net Inventories Prepaid expenses and other current assets Total current assets Long-term investments Equity investments Property, plant and equipment.net Deferred income taxes, net Other long-term assets Other intangible assets Goodwill TOTAL ASSETS LIABILITIES AND SHAREHOLDERS' EQUITY/(DEFICIT) Current liabilities: Accounts payable Accrued liabilities Accrued payroll and benefits Income taxes payable Stored value card liability and current portion of deferred revenue Current portion of long-term debt Total current liabilities Long-term debt Deferred revenue Other long-term liabilities Total liabilities Shareholders' equity/Ideficit: Common stock ($0.001 par value) - authorized 2.400.0 shares: issued and outstanding 1.184.6 and 1.309.1 shares, respectively Additional paid-in capital Retained earnings / deficit Accumulated other comprehensive loss Total shareholders' equity/ deficit) Noncontrolling interests Total equity/(deficit) TOTAL LIABILITIES AND SHAREHOLDERS' EQUITY/DEFICIT) 1189.20 1,753.70 664.60 1,291.70 1.752.50 656.80 102.80 1,269.00 6,168.70 11.167.00 6.744.40 1,370.50 25,450.60 1,642.90 349.90 5.684.20 9,090.20 6,775.70 1.430.50 22,980.60 1 1.20 1.30 41.10 41.10 15.721.2011 1457,40 (503.30 1330.30) 16.232.2011 1.169.50 1.20 6.30 16,231.00 1.175.80 $ 19,219.60 $ 24,156.40 | 2019 | 2018 Amounts Answer Amounts Answer Industry Average Current Ratio Current Assets Current Liabilities ID Quick Ratio, or "Acid Test Quick Assets Current Liabilities Quick assets include Cash, Marketable Securities, and Accounts Receivable (excludes Inventory) Inventory Turnover Cost of Goods Sold Inventory Accts Receivable Turnover Sales Accts Receivable Debt to Assets Total Liabilities Total Assets Debt to Total Liabilities Total Equity Equity Times interest Earned EBIT Interest expense 100 OOOOO OOOOO HOO LLLLL TULOUD EBIT means "Earnings before interest and Taxes" Net Income Net Profit Margin (%) Sales Gross Profit on Sales (%) O OOOO Gross Profit Sales Return Net Operating Income Total Operating Assets on Assets (%) aka ROI Return on Equity (%) Net Income Total Equity Earnings per Share (EPS) Net Income No, shares outstanding Market Price | Price/Earnings, Ratio (P/E) EPS P/E ratio changes daily with market price. If EPS is negative. ratio is "not applicable". Use "Basic". not "Diluted