

Answered step by step
Verified Expert Solution
Question
1 Approved Answer
Starbucks has a large, global supply chain that must efficiently supply over 17,000 stores. Although the stores might appear to be very similar, they
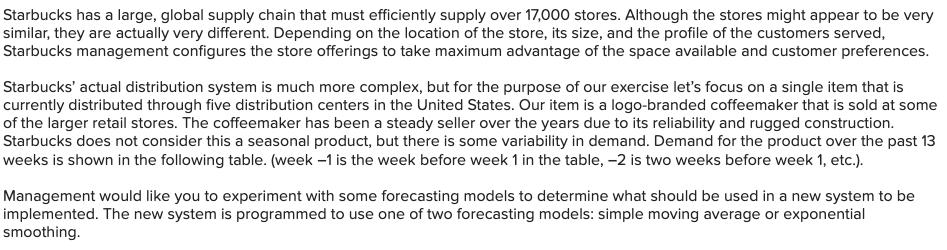
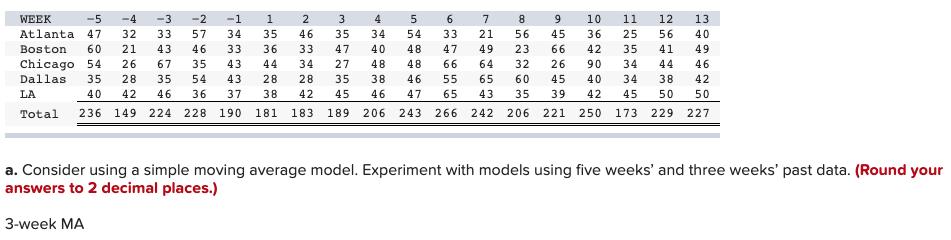
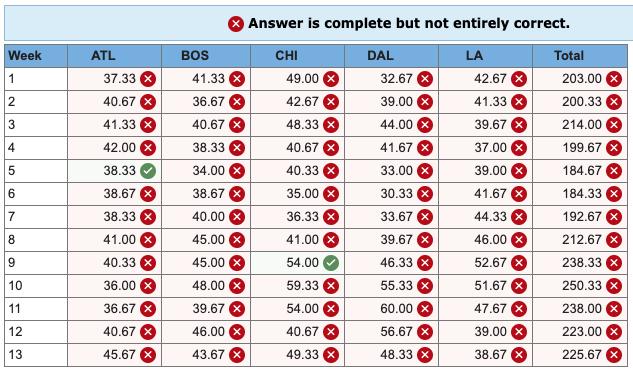
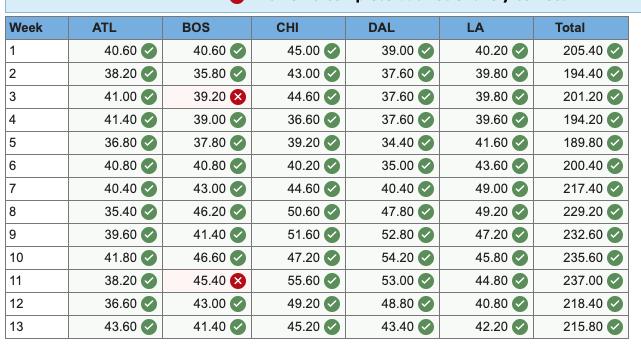
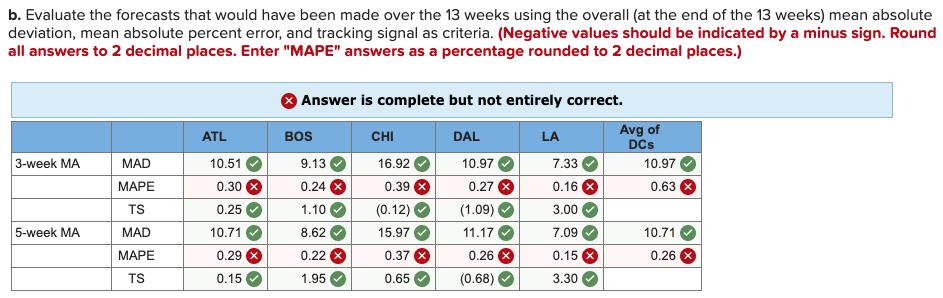
Starbucks has a large, global supply chain that must efficiently supply over 17,000 stores. Although the stores might appear to be very similar, they are actually very different. Depending on the location of the store, its size, and the profile of the customers served, Starbucks management configures the store offerings to take maximum advantage of the space available and customer preferences. Starbucks' actual distribution system is much more complex, but for the purpose of our exercise let's focus on a single item that is currently distributed through five distribution centers in the United States. Our item is a logo-branded coffeemaker that is sold at some of the larger retail stores. The coffeemaker has been a steady seller over the years due to its reliability and rugged construction. Starbucks does not consider this a seasonal product, but there is some variability in demand. Demand for the product over the past 13 weeks is shown in the following table. (week -1 is the week before week 1 in the table, -2 is two weeks before week 1, etc.). Management would like you to experiment with some forecasting models to determine what should be used in a new system to be implemented. The new system is programmed to use one of two forecasting models: simple moving average or exponential smoothing. -5 -4 -3 322 WEEK -2 -1 1 2 3 4 7 8 9 10 11 12 13 32 33 57 45 36 25 56 40 Atlanta 47 Boston 34 35 46 35 34 54 33 21 43 46 33 36 60 21 33 47 66 42 35 49 Chicago 54 26 67 35 40 48 47 49 23 44 34 27 48 43 28 28 43 48 66 64 32 26 90 34 44 46 Dallas. 35 28 35 54 35 38 46 55 65 60 45 40 34 38 42 LA 40 42 46 36 37 38. 42 45 46 47 65 43 35 39 42 45 50 50 Total 236 149 224 228 190 181 183. 189 206 243 266 242 206 221 250 173. 229 227 a. Consider using a simple moving average model. Experiment with models using five weeks' and three weeks' past data. (Round your answers to 2 decimal places.) 3-week MA Im wor 27 10 VA 564 NW WNA W w 5775 3443 00 00 5 5010 44 885 63 3465 246 45 53 6 1030 56 96 4624 1233 15 DA WAASH SOFT9N 14 41 - Week 1 2 3 4 5 6 7 8 9 10 11 12 13 ATL 37.33 X 40.67 X 41.33 X 42.00 38.33 38.67 38.33 41.00 X 40.33 36.00 X 36.67 X 40.67 X 45.67 BOS 41.33 36.67 X 40.67 38.33 34.00 X 38.67 40.00 45.00 X 45.00 48.00 39.67 46.00 X 43.67 Answer is complete but not entirely correct. CHI DAL LA Total 49.00 X 42.67 42.67 X 41.33 X 48.33 X 39.67 X 40.67 X 37.00 X 40.33 X 39.00 X 35.00 X 41.67 X 36.33 X 44.33 41.00 X 46.00 54.00 52.67 59.33 X 51.67 X 54.00 X 47.67 X 40.67 X 39.00 X 49.33 38.67 X 32.67 39.00 X 44.00 X 41.67 X 33.00 x 30.33 X 33.67 39.67 46.33 55.33 X 60.00x 56.67 X 48.33 203.00 200.33 X 214.00 199.67 X 184.67 X 184.33 192.67 212.67 238.33 X 250.33 X 238.00 X 223.00 X 225.67 Week 1 2 3 4 5 6 7 8 9 10 11 12 13 ATL 40.60 38.20 41.00 41.40 36.80 40.80 40.40 35.40 39.60 41.80 38.20 36.60 43.60 BOS 40.60 35.80 39.20 39.00 37.80 40.80 43.00 46.20 41.40 46.60 45.40 43.00 41.40 CHI 45.00 43.00 44.60 36.60 39.20 40.20 44.60 50.60 51.60 47.20 55.60 49.20 45.20 DAL 39.00 37.60 37.60 37.60 34.40 35.00 40.40 47.80 52.80 54.20 53.00 48.80 43.40 LA 40.20 39.80 39.80 39.60 41.60 43.60 49.00 49.20 47.20 45.80 44.80 40.80 42.20 Total 205.40 194.40 201.20 194.20 189.80 200.40 217.40 229.20 232.60 235.60 237.00 218.40 215.80 b. Evaluate the forecasts that would have been made over the 13 weeks using the overall (at the end of the 13 weeks) mean absolute deviation, mean absolute percent error, and tracking signal as criteria. (Negative values should be indicated by a minus sign. Round all answers to 2 decimal places. Enter "MAPE" answers as a percentage rounded to 2 decimal places.) Answer is complete but not entirely correct. Avg of ATL BOS CHI DAL LA DCS 3-week MA MAD MAPE TS 5-week MA MAD MAPE TS 10.51 0.30 0.25 10.71 0.29 0.15 9.13 0.24 X 1.10 8.62 0.22 X 1.95 16.92 0.39 X (0.12) 15.97 0.37 0.65 10.97 0.27 (1.09) 11.17 0.26 X (0.68) 7.33 0.16 3.00 7.09 0.15 3.30 10.97 0.63 10.71 0.26 X
Step by Step Solution
★★★★★
3.39 Rating (161 Votes )
There are 3 Steps involved in it
Step: 1
To evaluate the forecasts using the overall mean absolute deviation MAD mean absolu...
Get Instant Access to Expert-Tailored Solutions
See step-by-step solutions with expert insights and AI powered tools for academic success
Step: 2

Step: 3
Ace Your Homework with AI
Get the answers you need in no time with our AI-driven, step-by-step assistance
Get Started
Operations And Supply Chain Management
Authors: F. Robert Jacobs, Richard Chase
14th Edition
978-0077824921, 78024021, 9780077823344, 007782492X, 77823346, 978-0078024023